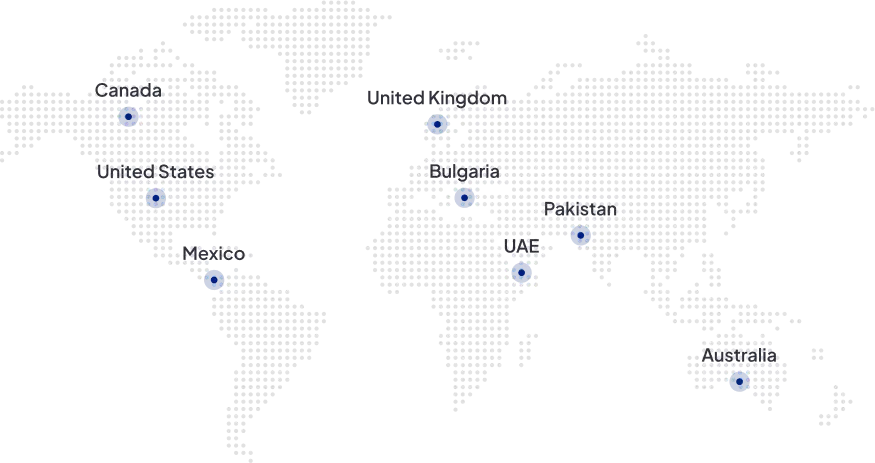


Trusted By Organizations across the world



Transform Your Agribusiness with Folio3's Agricultural Analysis Dashboard
Unlock the potential of your agricultural data with our Agriculture Analytics Dashboard, strategically crafted to transform complex farm data into valuable and actionable insights. Take charge of your agricultural operations with our user-friendly, customizable dashboards, empowering you to optimize crop performance, streamline resource allocation, and drive sustainable growth for your agricultural business.
Request a call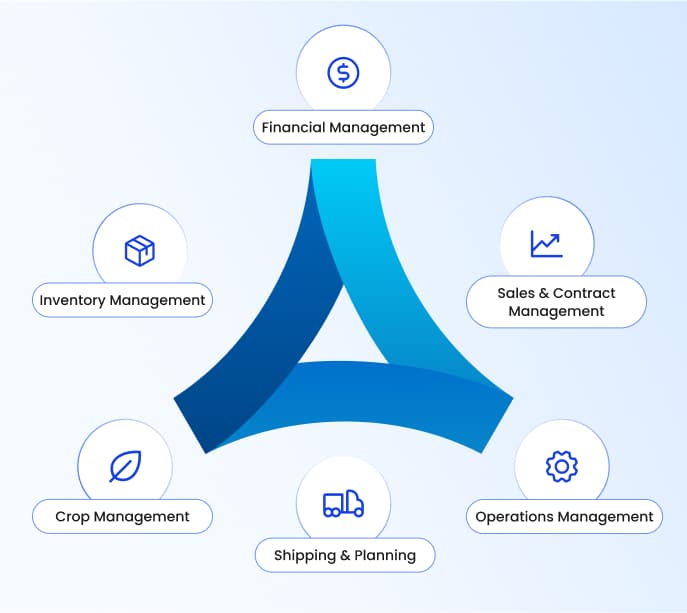
Why Does Your Agribusiness Need BI Reporting
Make informed decisions
Leverage real-time data from various sources for evidence-based decision-making.
Boost Efficiency
Optimize operations & resource use to reduce costs and increase productivity
Demand Forecasting
Improve demand forecasting based on historical data for better crop planning.
Market Alignment
Align with market trends for better pricing and sales strategies.
Enhance Crop Management
Gain real-time insights into your crops planning and on-going activities.
Financial Tracking
Monitor your finances closely to cut excessive costs and increase profitability.
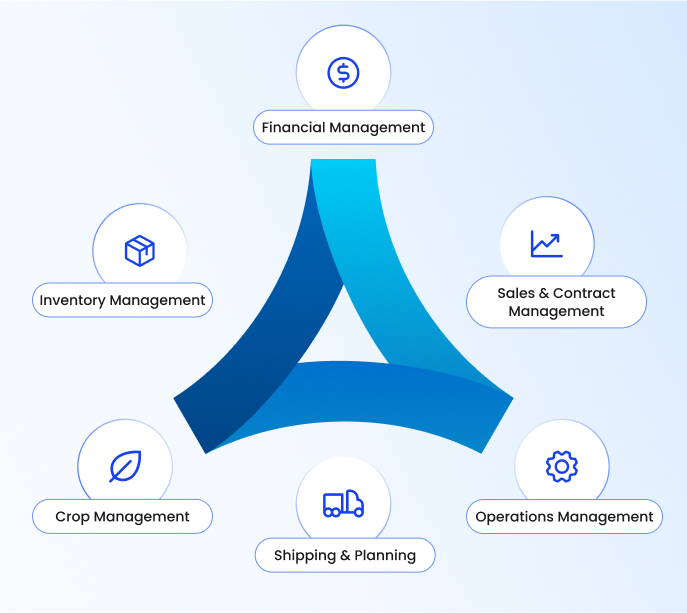
Covering All Areas of Your Farming Enterprise
Gain insights about every aspect of your farming activities for data driven decision making.
Farm Operations Management

Harvest Management

Crop Management

Warehouse Management

Supply Chain Management

Farm Irrigation Management

Farm Resource Management

Farm Financial Management
Get Microsoft Fabric Implementation Services Today
Start Your Project
What Our Agriculture Analytics Solution Offers
Pre-built & Customizable Dashboards
Our pre-built agricultural dashboard is a great starting point comprising all standard data points with the flexibility of customization according to your unique requirements.
REQUEST A CALLAdvanced Visualization
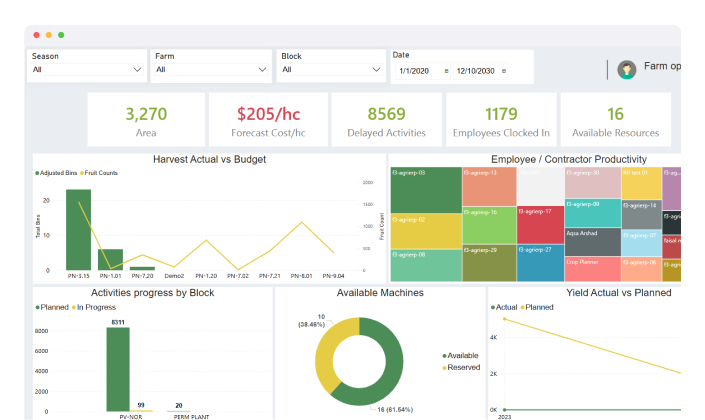
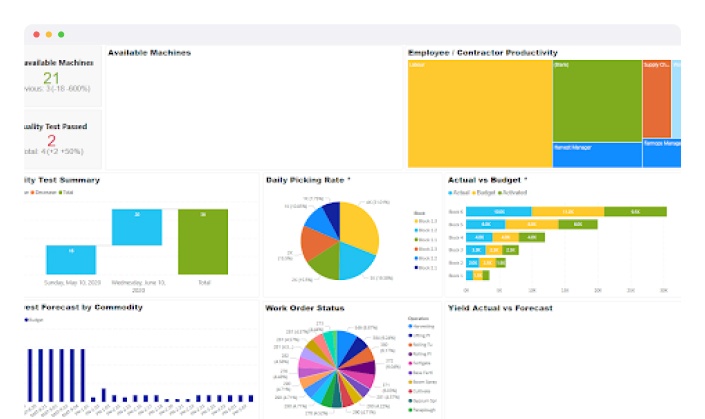
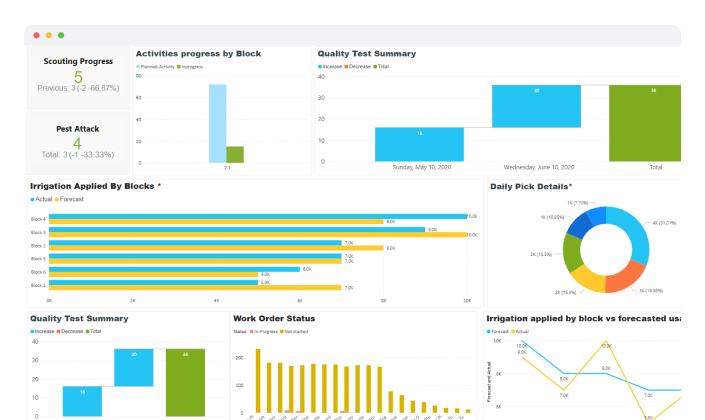
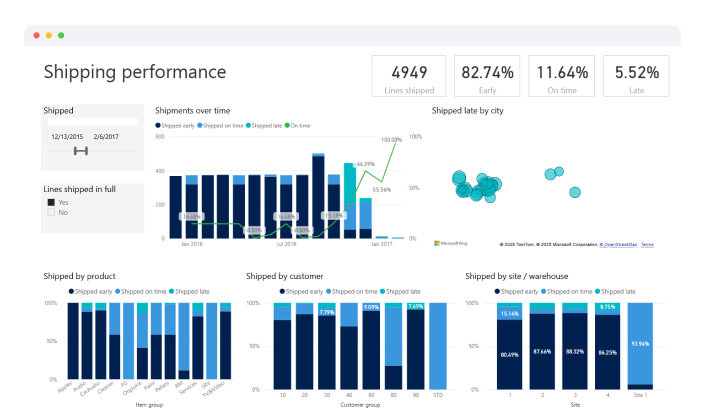
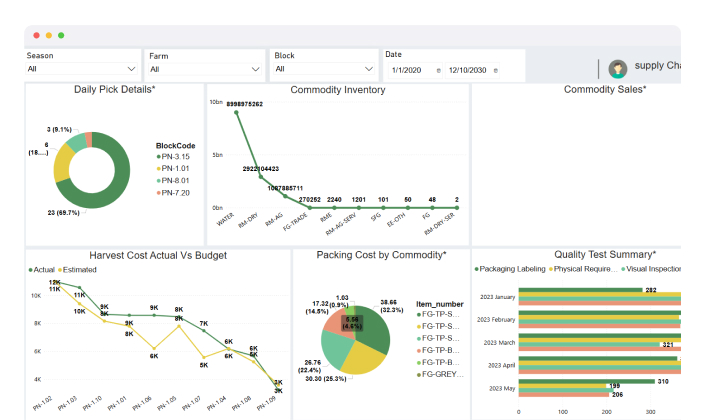
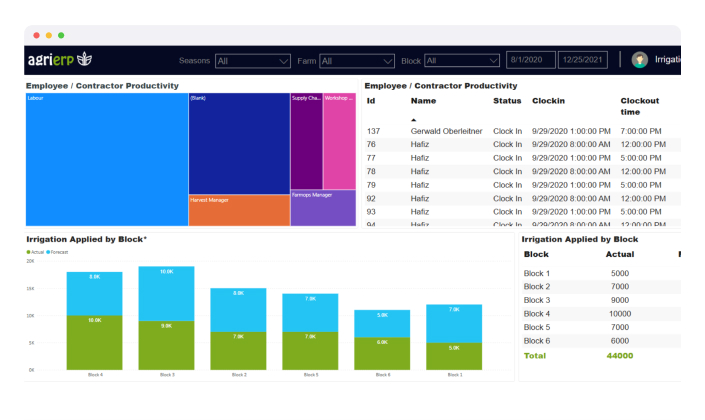
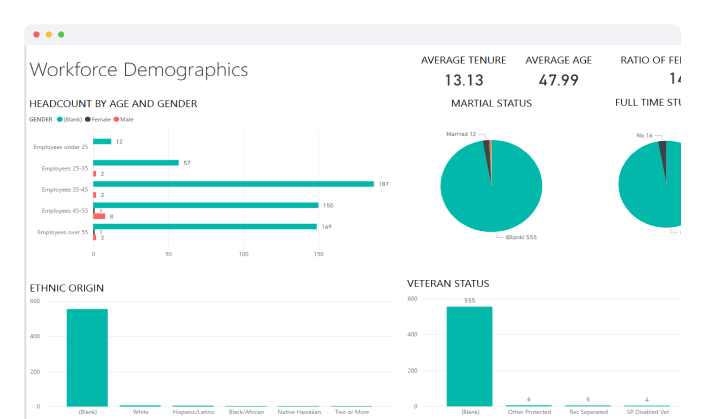
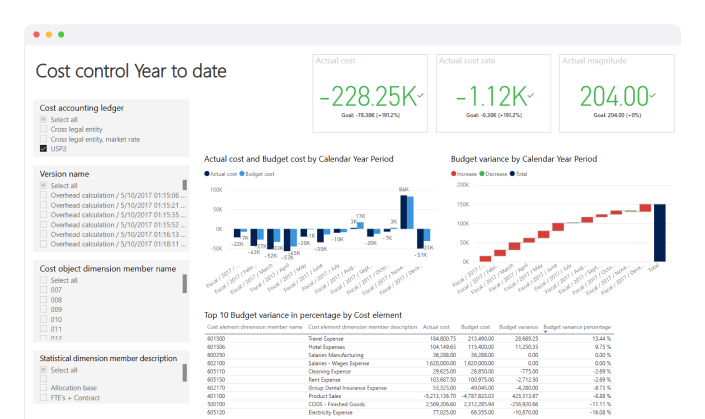
Our dashboard comprises advanced data visualizations such as graphs, maps, line charts, and other interactive charts to make data interpretation easier.
REQUEST A CALLMulti-Platform Compatibility
Whether you prefer PowerBI, Tableau, Qlik, or Looker Data Studio, we can tailor the dashboard according to your preferred platform.
REQUEST A CALLRole-Based Dashboarding
Get tailored information relevant to your role, whether you're an owner, farm operations manager, harvest manager, supply chain manager, or warehouse manager.
REQUEST A CALLData Consolidation
Through extensive data cleaning & modeling, we consolidate all your data sources including cloud-based softwares, ERP, sensors, etc, to provide a holistic view of your farm data.
REQUEST A CALLActionable Farm Insights
From crop management to financial tracking, gain granular insights to make informed decisions.
REQUEST A CALLUsability
Helps in managing your crop performance, resource utilization, operations, and more, in a simple, intuitive, & easy-to-use interface
REQUEST A CALLAwards &
Recognization











Gain in-depth Insights into your Farm Business
With our detailed pre-built agriculture data analytics dashboard, you will be able to gain crucial insights such as:
- What are your on-going operations and their current status
- Water Consumption for each crop type
- What was each employee’s productivity to determine labor cost.
- Identify reserved and available machinery to plan your next activities.
- What are your most profitable and least profitable crops in each season?
- Budgeted vs Actual cost consumed by each crop during a season to access your financial targets.
- Quantity of each resource such as fertilizer, pesticides, etc, were consumed by a crop.
- Based on historical data, calculate forecasted yield and compare with actual annual yield.
- Forecasted demand for upcoming season to plan your yield accordingly.
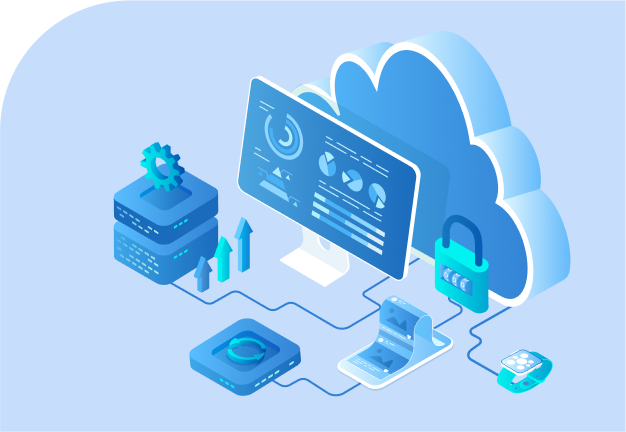
What makes us the best choice for Azure cloud service providers?
We believe in the power of the cloud to transform businesses and empower people.

Talk to an Azure engineer
Let's talk about your Azure project.
Schedule a 1:1 Call Today
Get in touch with our team to solve your Azure queries.
What makes us the best choice for Azure cloud service provid
Power BI is a business intelligence tool by Microsoft. It’s used in agriculture analytics to connect, visualize, and share data insights, facilitating the creation of interactive business intelligence reports and dashboards from multiple data sources.
Folio3 customizes Power BI services by providing tailored reports and dashboards, creating connections for data sources, and offering guidance and technical support to ensure user adoption.
The key benefits include making informed decisions through real-time data, boosting operational efficiency, improving demand forecasting, aligning with market trends, enhancing crop management, and closely monitoring finances to increase profitability.
Yes, Folio3 offers pre-built and customizable dashboards that start with standard data points and can be tailored according to unique requirements, ensuring flexibility and relevance.
The dashboard includes advanced data visualizations like graphs, maps, line charts, and other interactive charts, making data interpretation easier and more intuitive for users.
Yes, Folio3 ensures multi-platform compatibility, tailoring the dashboard to work seamlessly with preferred platforms like PowerBI, Tableau, Qlik, or Looker Data Studio.
Folio3 offers role-based dashboarding, providing tailored information relevant to various roles within an agribusiness, such as farm operations managers, harvest managers, supply chain managers, and more, ensuring that each user gets the most relevant data for their needs.