
Implementing Power Bi Dashboard For Food Crop Grower
Real-Time Visibility of Grower Operations Via Power BI and Improving Yield Potential by 12%
Williams, California
Agriculture and Crops
100+
About The Client
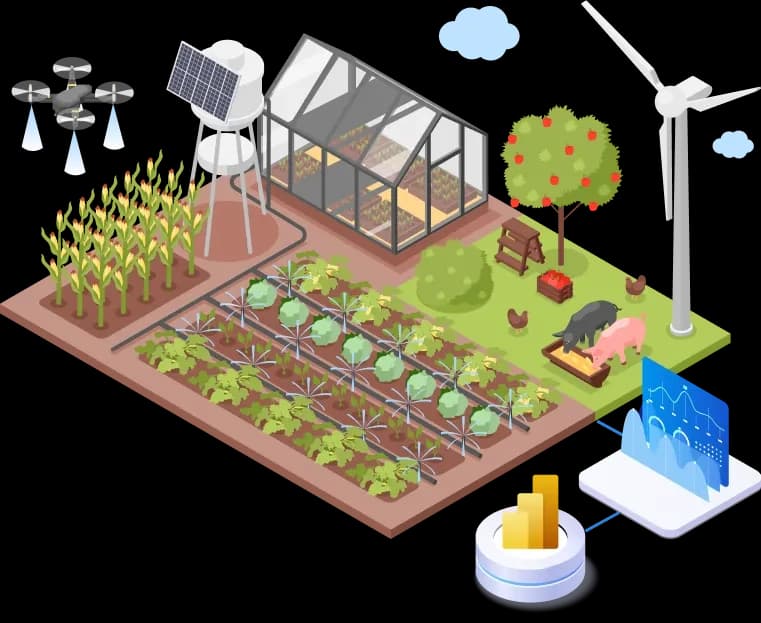
They are a family-owned food crop grower, situated in Williams, California. They specialize in cultivating almonds, walnuts, pistachios, and rice, thereby satisfying the food supply needs of both regional and national markets.
The Problem
Uncertain Operations and Disconnected Growers
The client lacked a centralized, real-time view of their critical growers’ data, which led to inefficient management and tracking of their grower contracts, field operations, and yield estimations.
FACING SIMILAR CHALLENGES?
Tracking of growers’ contract statuses (active, pending review, declined, voided) across numerous fields and acres was manual and time-consuming.

Lack of visibility into field operations (total acres by status and county, and progress of yield estimations) hindered decision-making.

Less focus on core farming activities due to the valuable time spent on compiling manual insights.

Growers lacked direct access to their contact and yield data, widening transparency gaps and halting collaborative opportunities.
Our Solution
A Comprehensive Power BI Grower Portal Dashboard
Folio3 designed and implemented a Power BI-based Grower Portal Dashboard. This provided an interactive and real-time visibility into growers’ operations and their contracts. The key features of the solution include:
Strategic Optimization of Existing Reports
We deeply analyzed Savills’ existing reporting infrastructure to highlight bottlenecks and refine reporting logic for maximized performance and data accuracy.
Interactive Widgets for Deep Insights
Tracking of subcontracts by status, field operations, and crop acreage. Real-time yield estimates compare against historical data, and county-level acreage changes highlight trends over time.
Dynamic Filtering Capabilities
Global filters for Crop Year, Division (VFO, YHS), and individual growers enable users to tailor their data views instantly.
Intuitive Drill-Down Functionality
Any segment within a chart is clickable, which highlights detailed lists of contracts, growers, fields, varieties, and acres in a tabular format, along with downloadable option.
Role-Based Access
The designed permission matrix enhances security. The categorized users are granted access based on their roles and assigned growers.
Business Outcomes
The implementation of Power BI Grower Portal Dashboard has stepped up their operational excellence and market position:

17% Increase in Operational Efficiency

12% Higher Potential Yields

Fortified Grower Relationships
Take A Seamless Cloud Ride With Us!
Get the power to boost your business, innovation, and growth.
Get Customized Azure Cloud Services
Talk to an Azure engineer
Let's talk about your Azure project.
Schedule a 1:1 Call Today
Get in touch with our team to solve your Azure queries.