
Pre-Built Reporting Dashboards for Faster, Smarter Decisions
Launch decision-ready Power BI dashboards for finance, sales, marketing, operations, ERP, CRM, and e-commerce reporting. Folio3 configures proven dashboard frameworks around your data, KPIs, and business goals, then scales them on Azure as your reporting needs grow.
Power BI supports interactive reporting from hundreds of sources, including Azure-native services, and can deliver analytics across devices, collaboration tools, applications, and business systems.
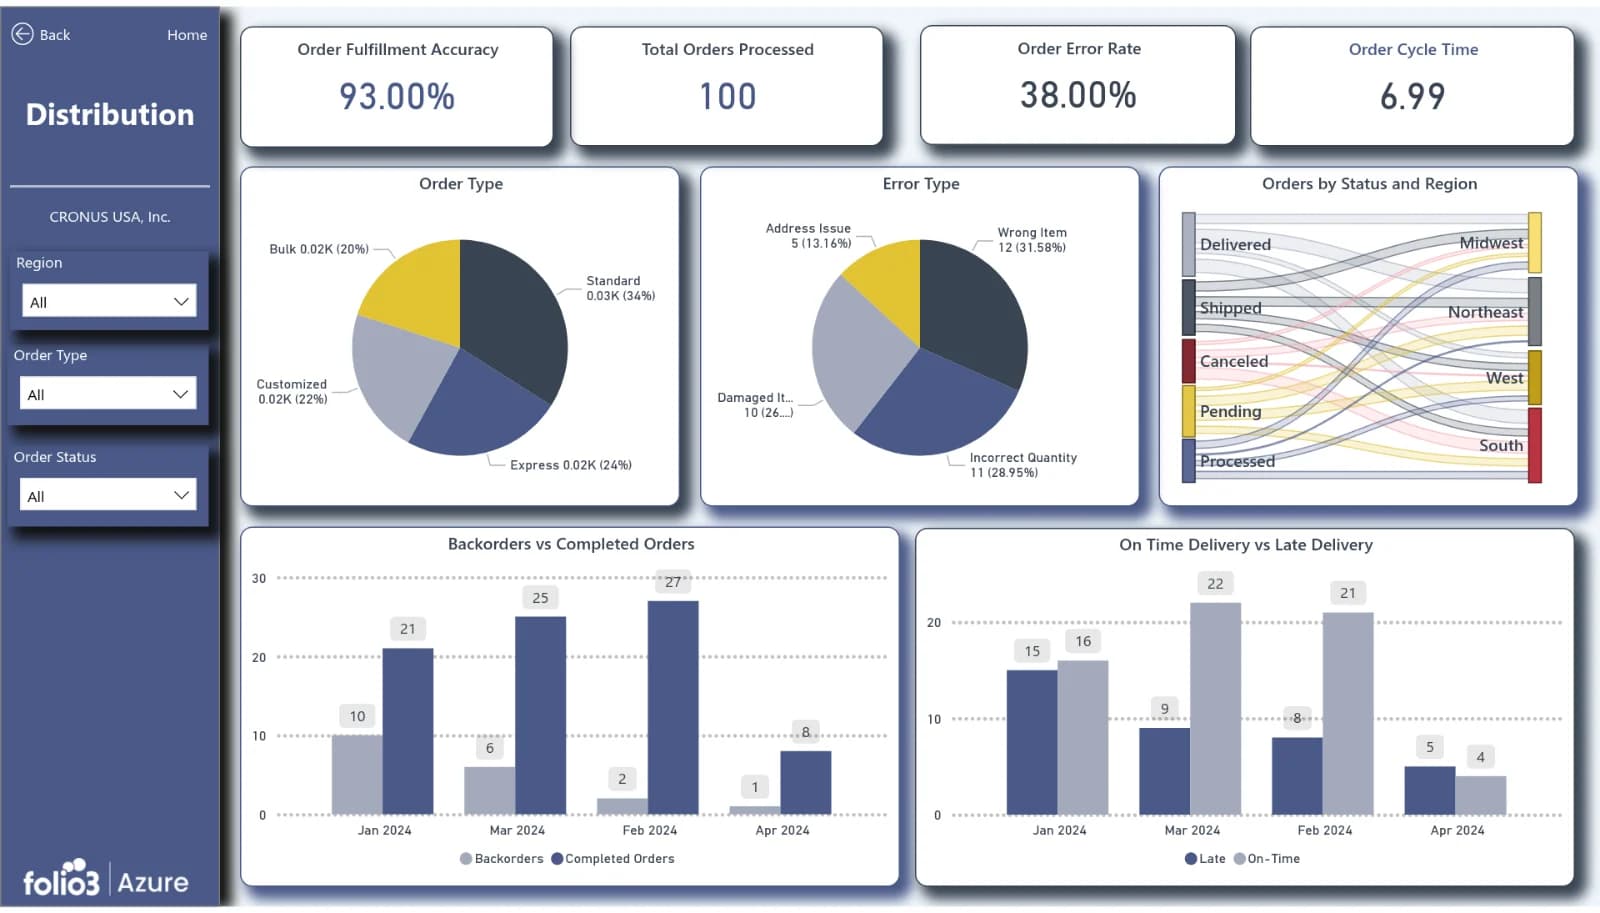
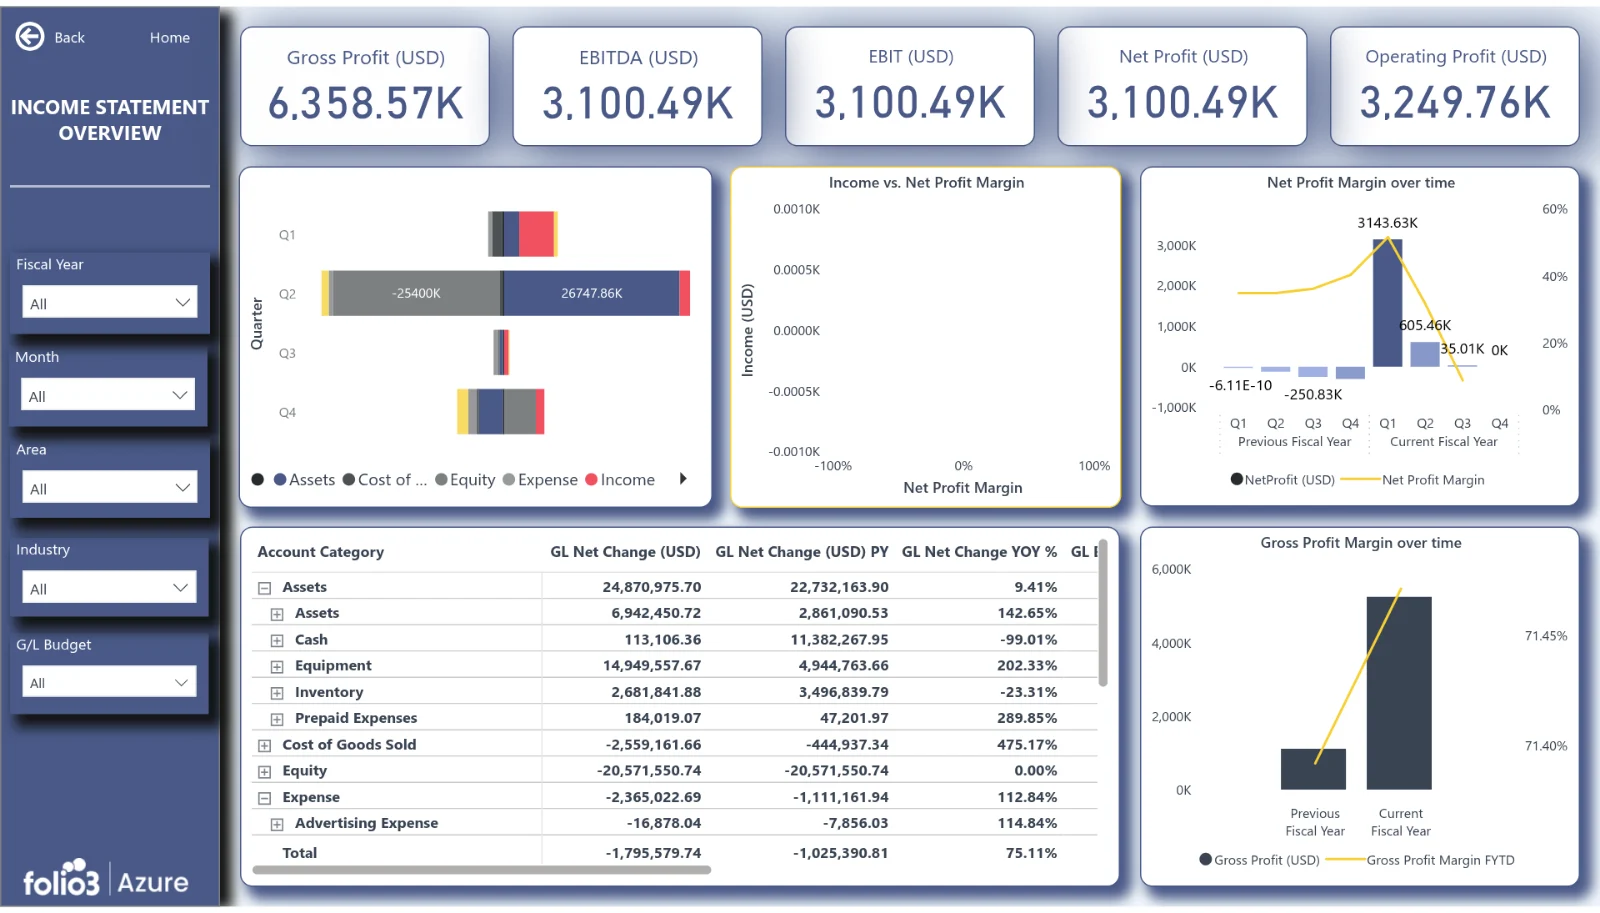
Make Every Decision Data-Driven
Manual spreadsheets, disconnected systems, and inconsistent KPI definitions make it hard to see what is really happening in the business. Even when the data exists, teams may spend too much time collecting it, reconciling it, and formatting it before they can act on it.
Folio3 helps you move from reactive reporting to a centralized view of performance.
With pre-built reporting dashboards, you can:
- Bring data from ERP, CRM, finance, marketing, e-commerce, operations, and custom applications into one reporting experience
- Track the KPIs that matter to leadership and functional teams
- Reduce repetitive spreadsheet-based reporting and manual consolidation
- Compare results by company, region, product, customer, team, channel, department, or time period
- Drill from executive-level KPIs into the underlying detail
- Schedule data refreshes and share controlled access with the right users
- Build a scalable reporting foundation that can grow with your Azure environment
Combine data from your business systems with Folio3’s Azure data integration services before it reaches your reporting layer.
Explore Dashboard Solutions by Business Function
Choose from proven dashboard frameworks designed around the way your teams make decisions. Each solution can be configured to reflect your KPIs, definitions, dimensions, hierarchy, and source-system data.
Executive and Leadership Dashboards
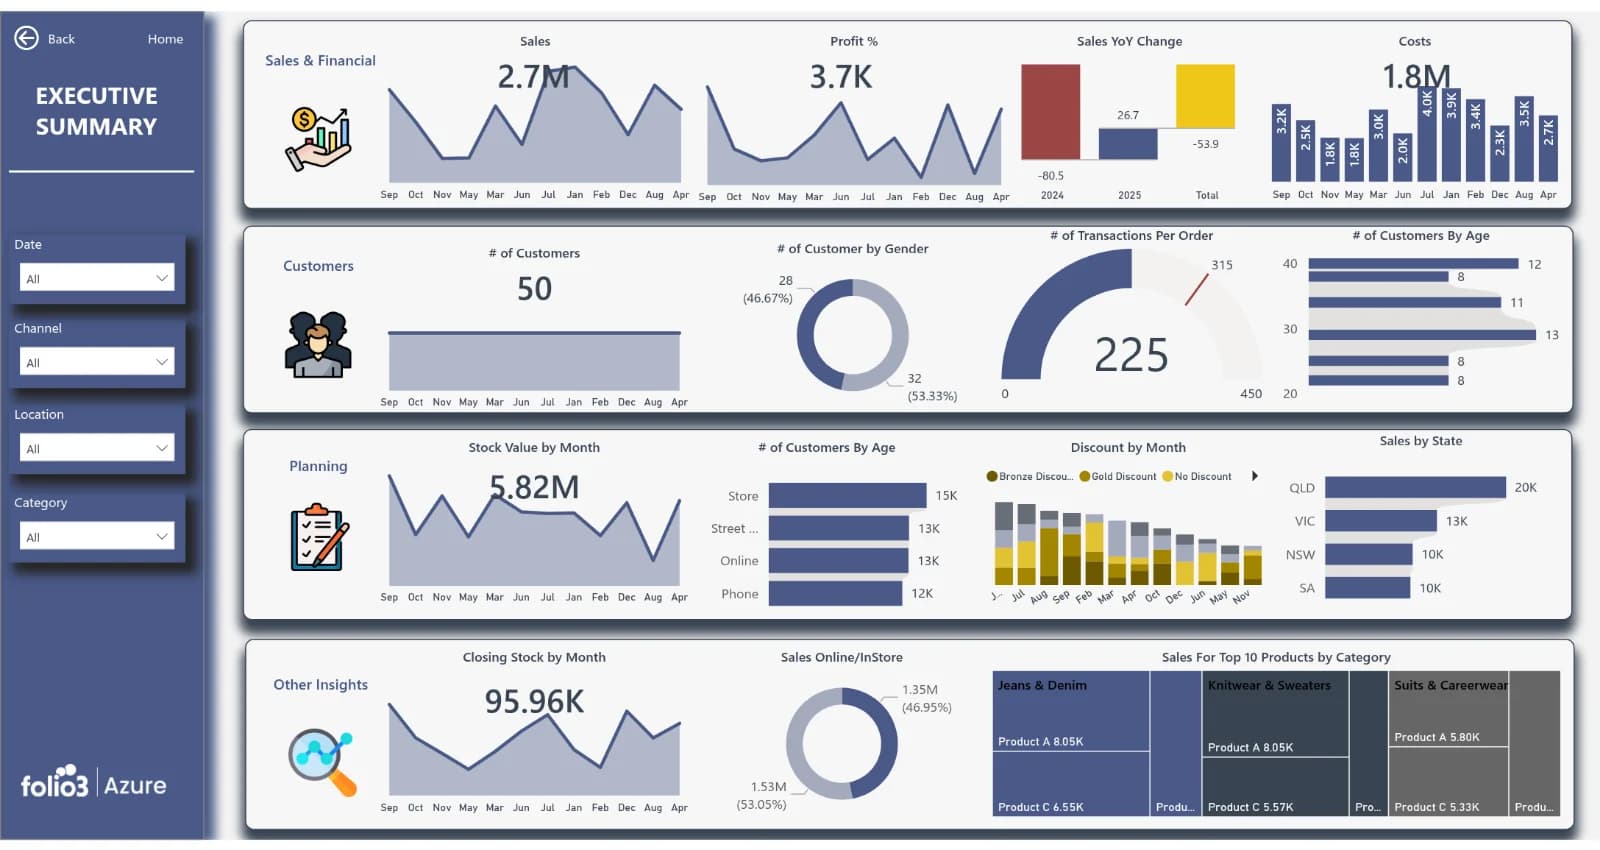
Give leadership a connected view of revenue, profitability, growth, cash position, operational performance, customer trends, and strategic KPIs. Replace disconnected management reports with a clear executive reporting layer.
Common executive dashboard metrics include:
- Revenue and gross margin
- Profitability by business unit, region, product, or customer
- Budget versus actual performance
- Cash flow and working capital
- Sales pipeline and forecast
- Customer acquisition, retention, and growth
- Operational and delivery performance
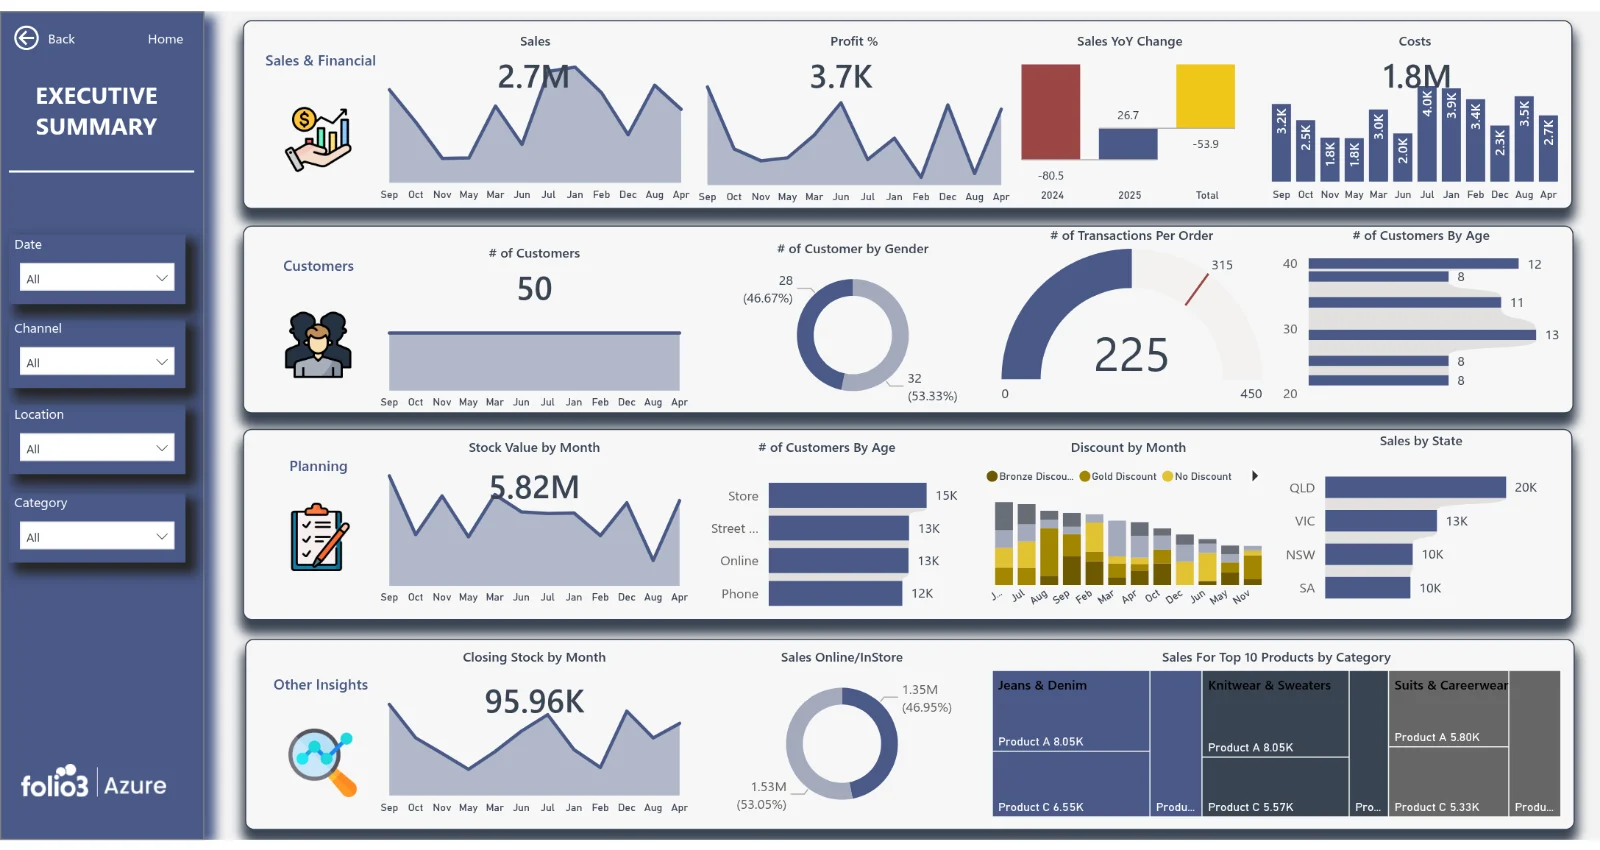
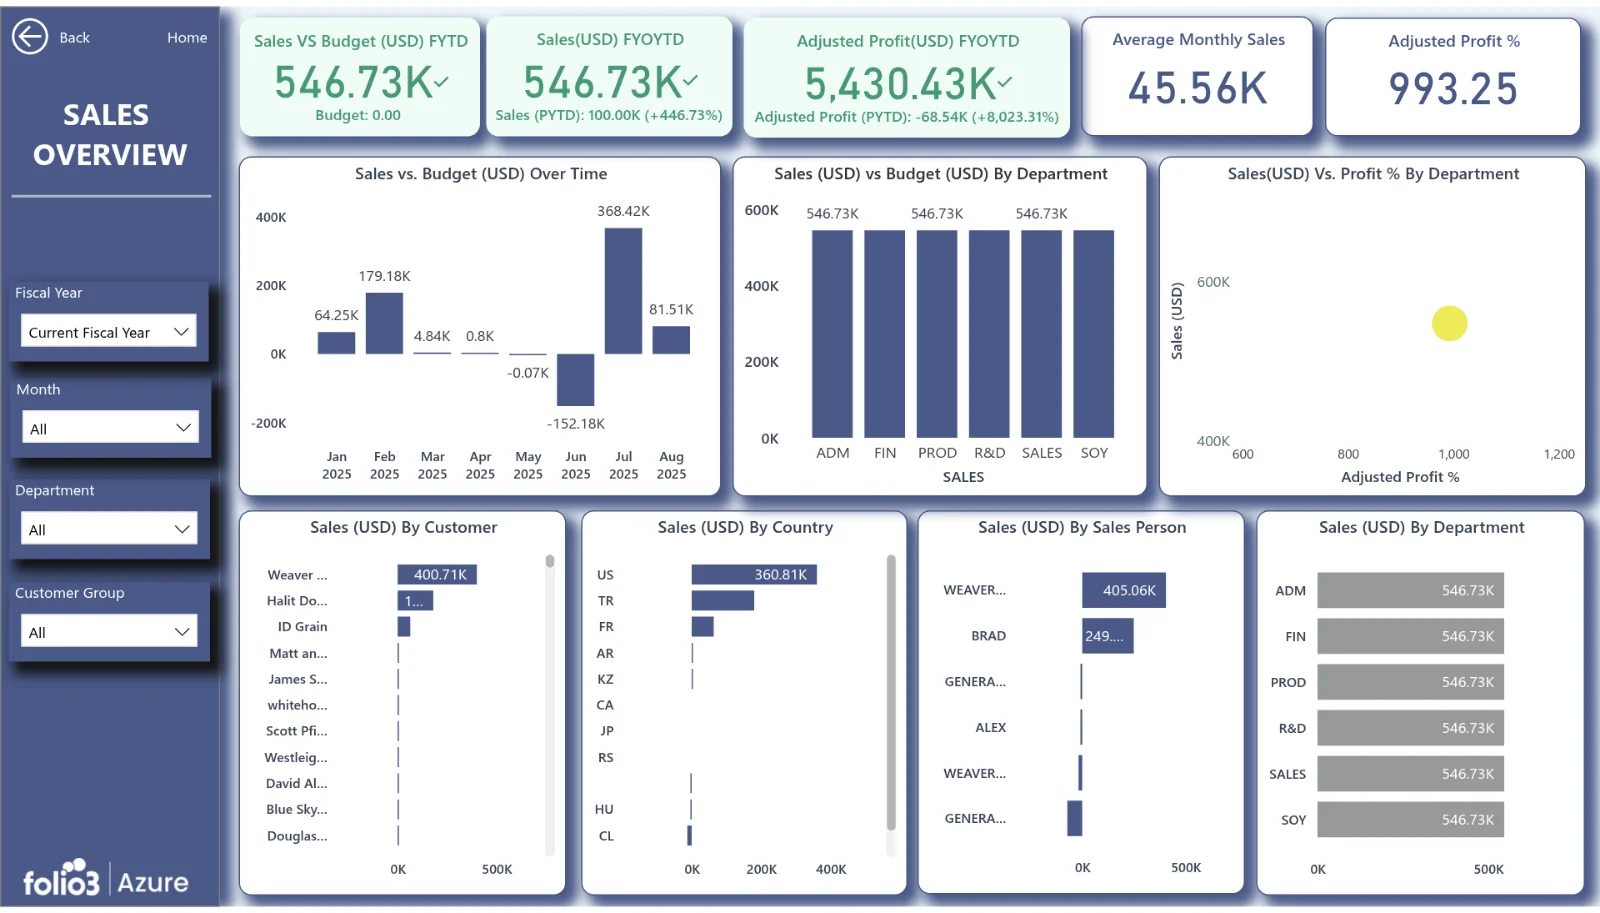
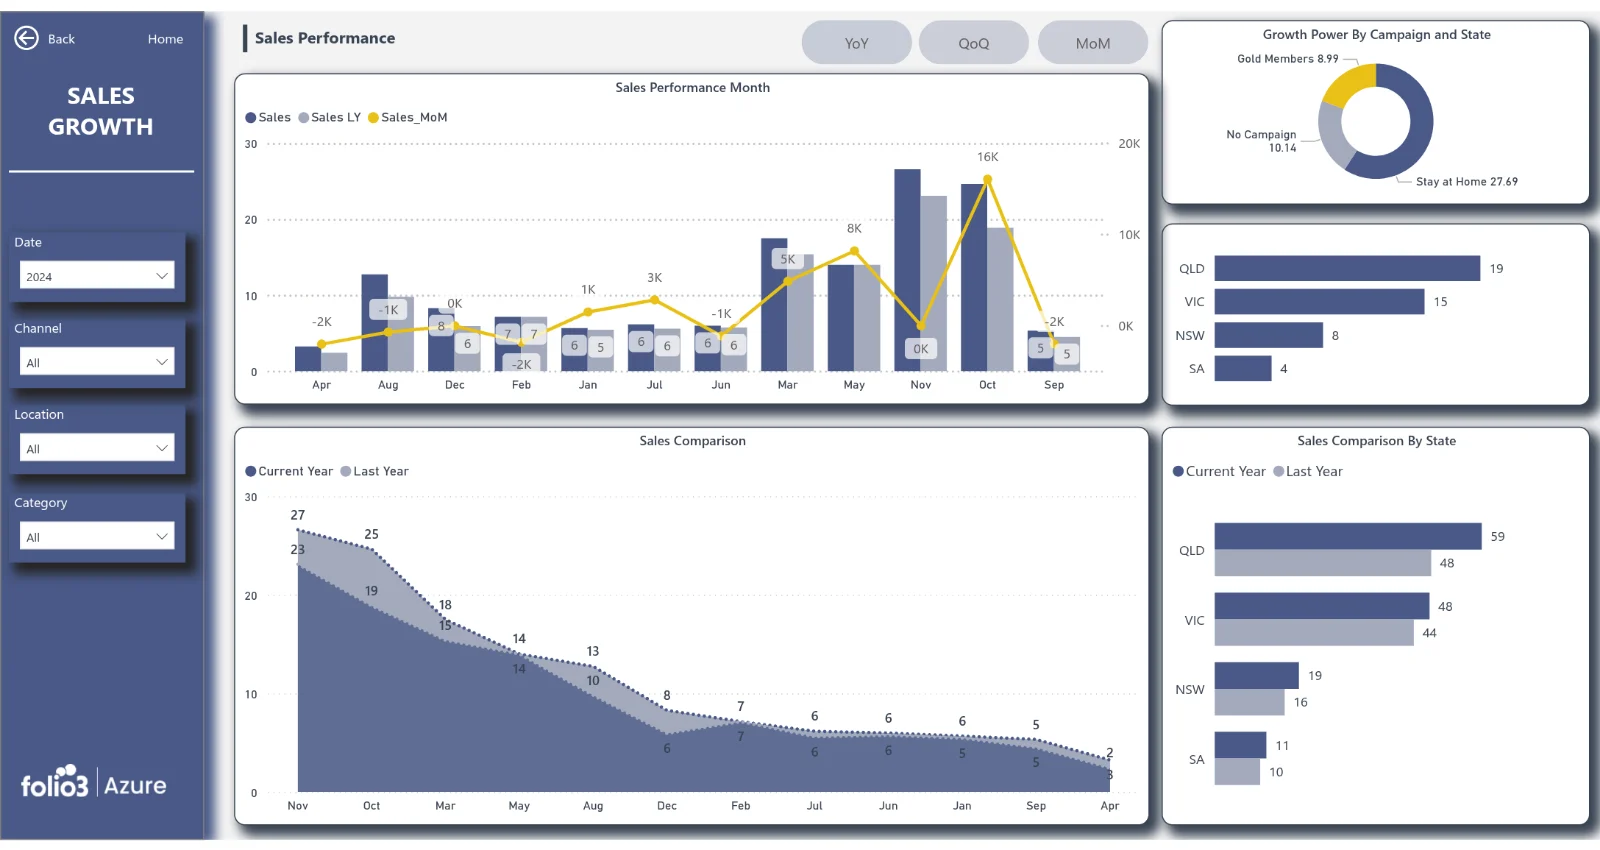
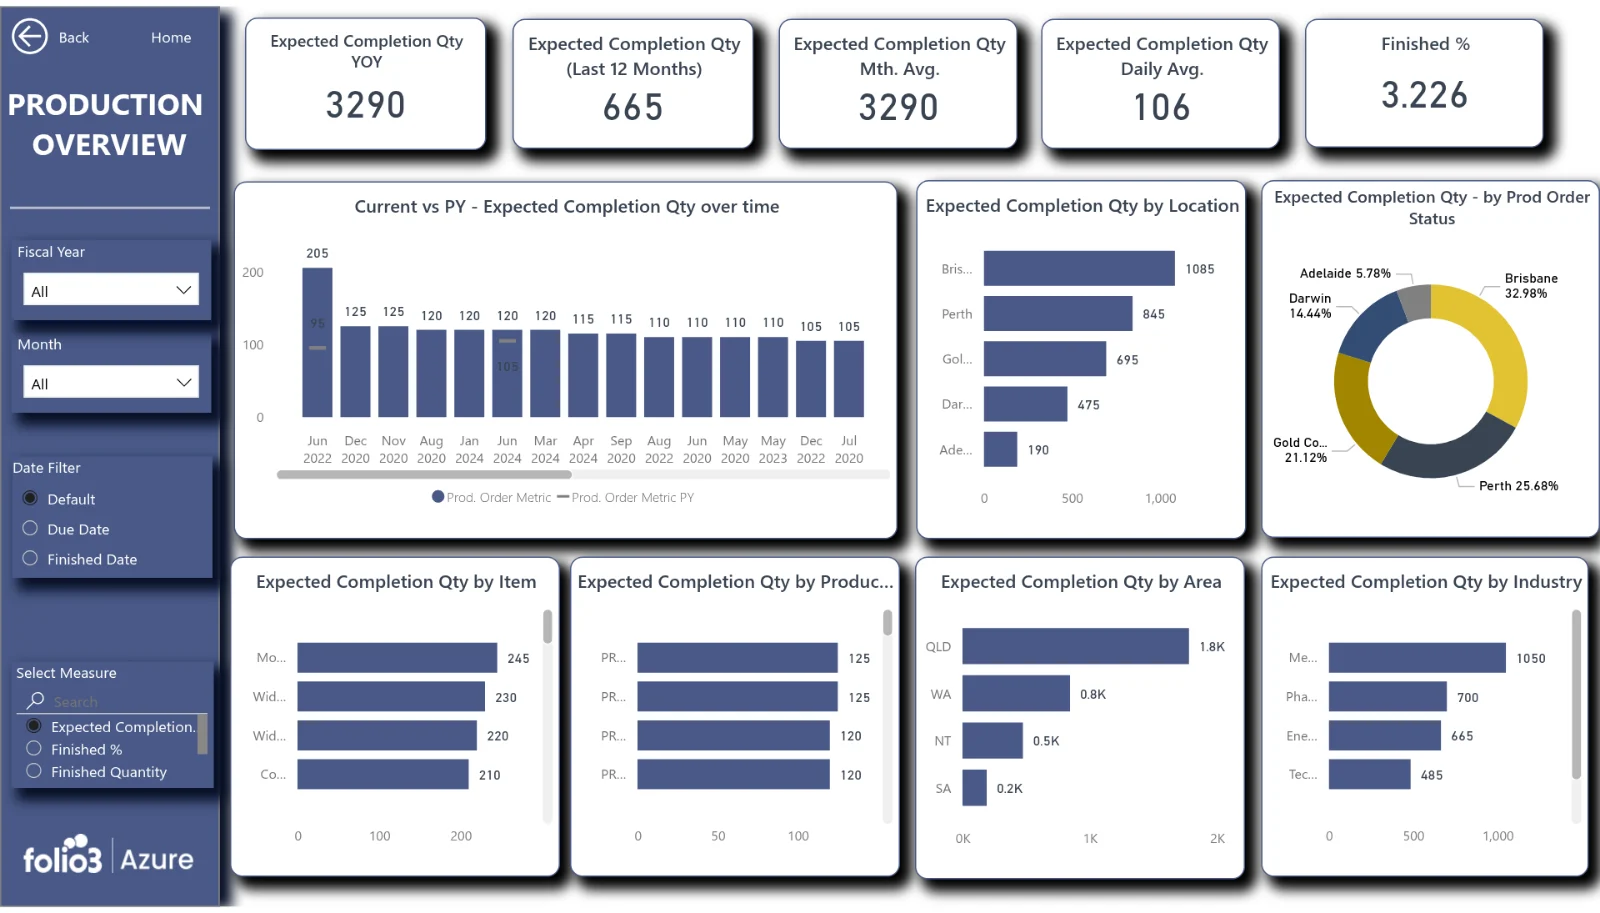
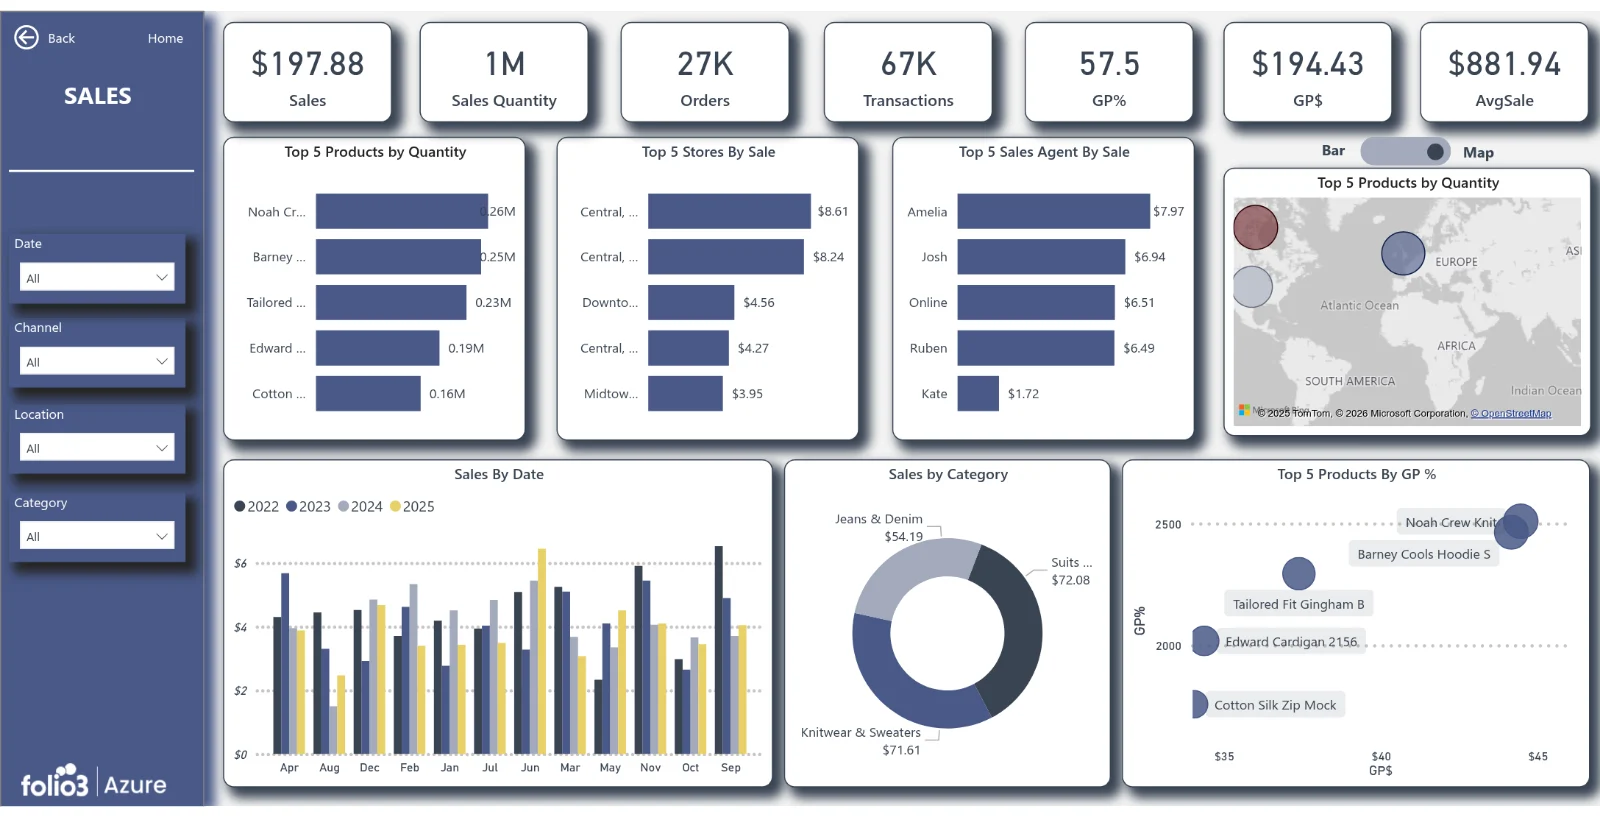
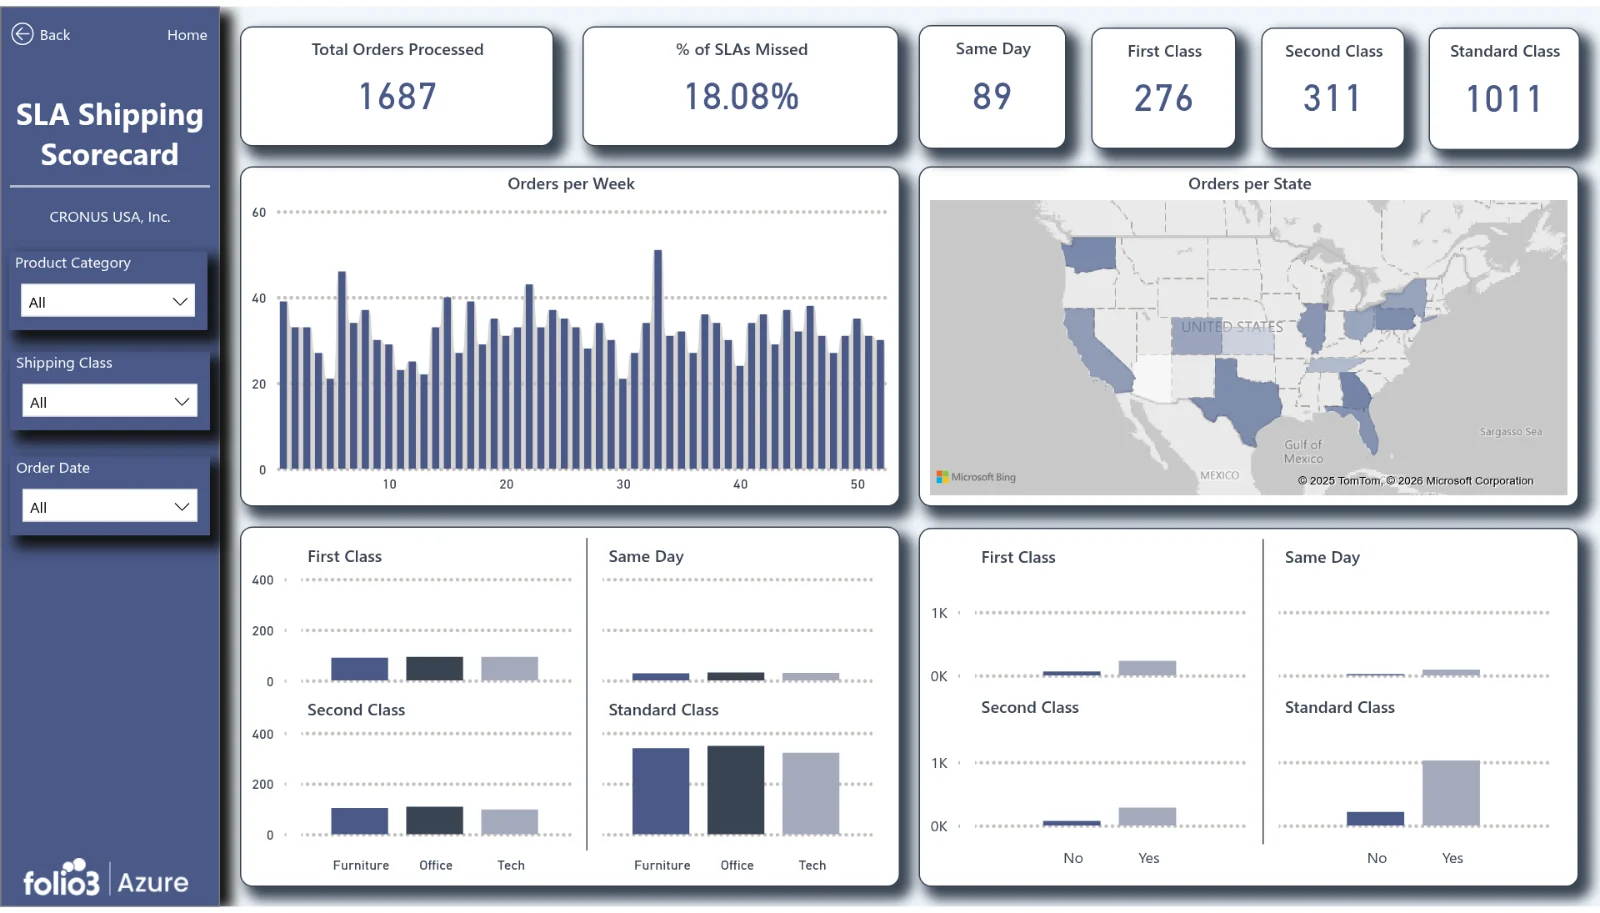
Extend dashboard insights with workflow automation, approvals, and low-code applications through Folio3’s Microsoft Power Platform services.
Connect the Data You Already Use
Your dashboards should reflect the way your business actually operates—not force your teams into a new system. Folio3 can design reporting solutions around a single source system or a multi-source data environment.
We can connect and prepare data from supported sources such as:
Folio3 validates source availability, data quality, refresh requirements, security, and reporting requirements during discovery. We then recommend the right reporting architecture—from direct dashboard connections for simpler use cases to a governed Azure data layer for complex, multi-source, high-volume, or enterprise reporting.
Azure and Power BI can support reporting across cloud-based, on-premises, single-source, multi-source, real-time, and enterprise-scale environments. Microsoft specifically notes that organizations can connect one or several Azure data sources, shape the data, and build reports around the result.
Explore Folio3’s Azure Data Analytics services for data engineering, integration, visualization, governance, and scalable analytics architecture.
Pre-Built Does Not Mean One-Size-Fits-All
A pre-built dashboard gives you a faster and lower-risk starting point. It does not mean your reporting must be generic.
Folio3 configures dashboards to match your business requirements, including:
- Business-specific KPI definitions and formulas
- Company, region, department, cost center, product, and customer dimensions
- Role-based views for executives, finance, sales, operations, and marketing teams
- Data filtering, drill-through, and data-detail requirements
- Branding, layout, terminology, and report navigation
- Multi-company, multi-currency, multi-location, and multi-entity reporting
- Historical comparisons and forecasting requirements
- Scheduled data refresh and exception monitoring
- Security and access controls
- Custom source-system connections and API integrations
Our approach combines the speed of reusable reporting frameworks with the flexibility of a tailored Power BI and Azure analytics solution.
Pre-Built Dashboards vs. Other Reporting Options
What You Receive
Every dashboard engagement is scoped according to your business requirements, data landscape, and reporting goals. Depending on the selected solution, your deliverables may include:
Keep your reporting environment reliable with Folio3’s Azure Managed Services for monitoring, optimization, security, and ongoing support.
How We Deliver Your Dashboard Solution
Discover
We begin by understanding your reporting challenges, source systems, stakeholder roles, existing reports, KPI definitions, and the decisions your teams need to make.
Connect and Prepare
We assess and connect approved sources, map the required data, identify data-quality considerations, and recommend the right data refresh and architecture approach.
Configure and Customize
We apply the relevant dashboard framework, configure metrics and dimensions, design user-friendly views, and tailor the experience to your teams.
Validate and Reconcile
We review results with business stakeholders, reconcile key measures against approved source reports, confirm security requirements, and refine the dashboards before launch.
Launch and Scale
We train users, deploy the reporting solution, monitor adoption, and create a roadmap for additional dashboards, data sources, automation, Azure analytics, or embedded reporting.
Turn Your Business Data Into Clearer Decisions
Start with proven reporting dashboards. Configure them around the KPIs that matter. Scale with Azure when your reporting needs grow.
Whether you need an executive dashboard, financial reporting, sales analytics, marketing performance reporting, operational visibility, or a unified view across multiple systems, Folio3 can help you launch faster with a reporting solution built for your business.
Built for Azure. Ready to Scale.
Your initial dashboard requirement may be simple: visibility into sales, finance, marketing, or operational data. But as your business grows, reporting often needs to handle more users, sources, history, governance, refresh frequency, and analytical complexity.
Folio3 helps you start with the reporting outcomes you need now and build toward a scalable Azure analytics foundation.
Depending on your environment, this can include:
- Azure Data Factory or Microsoft Fabric for data ingestion and transformation
- Azure SQL, Data Lake, Synapse, Fabric, or Databricks for scalable data storage and processing
- Power BI semantic models for standardized KPIs and trusted reporting
- Role-based access and governance practices
- Real-time and near-real-time operational reporting where needed
- Power BI Embedded for dashboards inside web applications, portals, or customer products
- AI-enabled insights, forecasting, and advanced analytics as data maturity increases
Microsoft describes Power BI as an enterprise and self-service analytics service that can connect to hundreds of sources, support interactive reports, share insights across an organization, and embed analytics into websites or applications. Azure data services can extend that reporting layer with large-scale storage, integration, and processing capabilities.
Work with Folio3’s Azure cloud consulting services to design the secure, scalable foundation behind your reporting and analytics environment.
Why Choose Folio3
Folio3 brings together Azure expertise, data engineering capability, Power BI reporting experience, and business-focused solution delivery.
- A faster alternative to starting every dashboard from a blank canvas
- Reporting designed around your business users, KPIs, and decision-making process
- A partner that can connect business systems and prepare data—not only design visuals
- Flexible support for one system, multiple sources, cloud data platforms, and custom applications
- A practical path from immediate dashboards to scalable Azure analytics
- Help with data integration, reporting automation, governance, security, and managed support
- An experienced Azure partner with a global delivery capability
Frequently Asked Questions
What are pre-built reporting dashboards?
Are these dashboards only for Microsoft Dynamics 365?
Can Folio3 combine multiple data sources in one dashboard?
Can the dashboards be customized?
Do we need Power BI licenses?
How long does implementation take?
Can dashboards be embedded in our application or customer portal?
Who owns our data and dashboard assets?
Talk to an Azure engineer
Let's talk about your Azure project.
Schedule a 1:1 Call Today
Get in touch with our team to solve your Azure queries.