Table of Contents
ToggleIn the digital age, data is the new currency. Efficient data analytics and visualization tools not only enhance business decision-making but can also drive innovation and competitive advantage. Microsoft, a leader in enterprise software, offers a rich suite of data analytics and visualization tools catered to diverse business needs.
Among these, Microsoft Fabric and Power BI stand out as central pillars of Microsoft’s data analytics offerings. This comprehensive analysis will guide data analysts, business intelligence professionals, and tech enthusiasts in understanding the nuanced differences between the two, so they can make informed decisions aligned with their organizational goals.
Understanding Microsoft Fabric and Power BI
Before any comparison can be made, it’s crucial to gain a comprehensive understanding of each offering. Microsoft Fabric and Power BI share the same aim — to empower organizations with actionable insights — but their approaches and toolsets vary significantly.
While both may seem interchangeable to the untrained eye, discerning their unique value propositions is critical to selecting the right tool for your data-focused needs.
Exploring Microsoft Fabric: Core Features and Capabilities
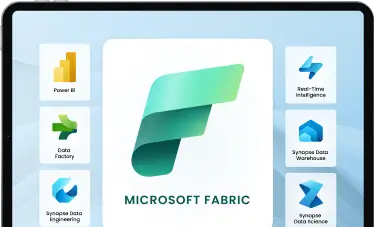
Microsoft Fabric, a relatively recent introduction, is a framework designed to help developers build enterprise-grade analytic applications. It emphasizes consistent design patterns and provides a set of tools for creating compelling, data-driven visualizations within business applications.
Fabric’s strength lies in its scalability and the coherent experience it delivers across various screen sizes and touch devices. Equipped with intuitive controls and extensive data sources, it enables the creation of apps that can display complex information in ways that are easy to grasp for users at all levels.
Accelerate smart decisions with Microsoft Fabric's unified data and AI analytics.
Demystifying Power BI: An Overview
Power BI, on the other hand, is a well-established self-service business intelligence solution that allows users to analyze and visualize data from a variety of sources. With its robust set of features, including rich visuals, interactive reports, and up-to-date dashboards, Power BI puts the power of data analysis into the hands of decision-makers at every level of an organization.
Power BI excels at transforming raw data into coherent insights, providing a platform that is as user-friendly as it is powerful. Its seamless integration with other Microsoft products, extensive custom visuals gallery, and the capability for real-time data processing make it a go-to solution for many businesses.
Key Differences Between Fabric and Power BI
Upon closer inspection, the contrasts between Microsoft Fabric and Power BI become apparent. Each platform has strengths that cater to distinct stages of the data analytics process and align with different user roles within an organization.
Distinctive Features: Fabric vs. Power BI
Comparing the features side by side reveals how Fabric’s focus on application integration and user experience contrasts with Power BI’s emphasis on dynamic and interactive reporting. While Fabric aims to enrich existing applications with analytics, Power BI focuses on standalone reports and dashboards that can be readily consumed and shared.
Data Handling and Analytics Approach
The handling of data is at the core of any analytics tool, and Microsoft Fabric and Power BI take unique approaches. Fabric leans on a more integrated data modeling strategy, intricately weaving analytics into the fabric of applications, while Power BI champions agile, user-centric modeling, which allows for more dynamic adjustments to analyses and reports.
Choosing the Right Tool for Your Business
Understanding the nuances between Microsoft Fabric and Power BI is only the first step. The critical question remains: which one is the right fit for your business? By delving into the specific use cases, integration flexibility, and strategic considerations, organizations can make informed decisions that harness the full potential of their chosen platform.
Use Cases and Application Scenarios
Real-world applications and use cases shed light on how different organizations can leverage Microsoft Fabric and Power BI. While businesses with pre-existing applications and a focus on user experience might lean towards Fabric, those needing swift analysis and dynamic reporting may prefer the accessibility and ubiquity of Power BI.
Strategic Considerations
Evaluating the long-term implications of integrating a data analytics platform is essential. Considerations such as team skill sets, future scaling requirements, and compatibility with existing IT ecosystems can influence the choice. It is important to look beyond the immediate features and understand how each platform aligns with the organization’s strategic vision.
A Comparative Summary
In the end, Microsoft Fabric and Power BI are complementary tools in Microsoft’s data analytics arsenal. A summary comparison can serve as a quick reference for organizations debating between the two products.
Criteria | Microsoft Fabric | Power BI |
Data Integration | Deep application integration with Azure services | Broad range of data connectors for a holistic view of information |
Visualization | Focused on in-app visualizations | Rich and interactive standalone visualizations |
Collaboration | Allows for team-based development | Encourages collaboration through shared dashboards and reports |
Scalability | Scales with application needs | Adapts to data growth and user demand |
Recommendations and Next Steps
It’s clear that Microsoft Fabric and Power BI each have compelling attributes that could be invaluable for different types of businesses. Recommendations for selecting the ideal platform will depend on use case scenarios, organizational objectives, and technological landscapes.
Experimenting with each tool through demos, trials, and in-depth consultations with specialists will provide firsthand insight into how they align with your company’s needs.
In an evolving business climate, the right data analytics and visualization tool is not just a product but a strategic asset. Both Microsoft Fabric and Power BI represent the pinnacle of data-driven technologies — the key lies in understanding your data, your users, and your business to unlock their true potential.
Microsoft’s Fabric and Power BI stand at the forefront of business technology, each offering distinctive capabilities for integrating data visualization and analytics into organizational processes.
Fabric excels in scalability and creating a seamless user experience across devices and platforms. Its intuitive design controls and diverse data source compatibility facilitate the development of applications that simplify complex data interpretation for users of varying expertise.
Conversely, Power BI is a powerhouse for self-service business intelligence, enabling users to derive insights and visualize data from an array of sources with ease. It shines in creating exhaustive, interactive reports and up-to-date dashboards, democratizing data analysis across organizational layers.
Its integration with Microsoft’s ecosystem, a vast library of custom visuals, and capabilities for real-time analytics solidify its position as a preferred solution for robust data storytelling.
Analyzing the Contrasts: Fabric vs. Power BI
A detailed examination reveals the nuanced differences between Fabric and Power BI. Fabric’s design is tailored for enhancing applications with embedded analytics, focusing on a unified user experience. In contrast, Power BI is geared towards generating interactive, agile analytical reports and dashboards for comprehensive standalone use.
Approaches to Data Management and Analysis
Both platforms embody unique philosophies toward data management. Fabric integrates analytics within applications, promoting a seamless blend of functionality and data insights. On the flip side, Power BI advocates for flexible, user-driven data exploration and report generation, catering to the dynamic needs of business analysis.
Identifying the Best Fit for Your Organization
Selecting between Microsoft Fabric and Power BI hinges on understanding not only their technical merits but also their alignment with your business needs and goals. Delving into use cases, assessing integration capabilities, and weighing strategic priorities can guide organizations to the most appropriate choice.
Tailoring to Business Needs
Each platform’s real-world applications highlight their suitability for different organizational scenarios. Companies prioritizing embedded user experiences may gravitate towards Fabric, while those in need of comprehensive, agile reporting might find Power BI more fitting.
Strategic Planning for Integration
The decision to adopt either platform should factor in longer-term considerations such as team expertise, scalability prospects, and ecosystem compatibility. It’s crucial to forecast how these tools fit into your company’s future technological and strategic framework.
Summarizing the Comparison
Ultimately, Microsoft Fabric and Power BI serve complementary roles within Microsoft’s suite of data analytics tools. The following summary table offers a glance at how they stack up against key criteria.
Criteria | Microsoft Fabric | Power BI |
Data Integration | Integrates deeply with applications and Azure services | Connects with a wide variety of data sources for a comprehensive view |
Visualization Capabilities | Prioritizes embedded application visualizations | Offers diverse, interactive stand-alone visualizations |
Collaborative Features | Facilitates collaborative app development | Promotes team collaboration via shared dashboards and reports |
Scalability | Matches the application’s scaling requirements | Adjusts to accommodate increasing data and user numbers |
Guiding Towards an Informed Decision
In choosing between Microsoft Fabric and Power BI, businesses must consider their unique operational contexts and strategic plans. Engaging in trials, leveraging demos, and consulting with experts can provide valuable insights into how each platform can be tailored to meet specific organizational needs.
In today’s dynamic business environment, selecting the right analytics and visualization tool is a strategic endeavor that underscores a company’s commitment to harnessing its data for meaningful insights and decision-making.
Both platforms embody modern data-driven innovation, poised to unlock powerful opportunities for those who adeptly align them with their business strategies and objectives.