How Azure BI Tools Work Together
Azure BI integrates services like Azure Synapse (a unified analytics service) and Azure Data Factory (a managed ETL pipeline) to streamline data handling. Power BI sits atop this stack to turn processed data into intuitive visuals.
By storing data in Azure Data Lake Storage, companies gain a massively scalable, secure repository for structured and unstructured data.
For example, Azure Synapse combines big data and data warehousing capabilities in one framework, while Azure Data Factory provides a visual, serverless environment to consolidate and transform data from 90+ sources. At Folio3 Azure, we simplify data movement and transformation in our Data Integration as a Service offering.
This end-to-end connectivity from databases and cloud apps to analytics tools means businesses can build real-time, context-rich reports for any use case.
The Azure BI platform even embeds AI and machine learning (via Azure ML and Azure Databricks) so that insights like trend forecasts and anomalies are generated automatically, further accelerating time-to-knowledge.
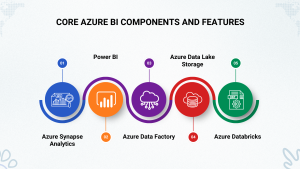
Core Azure BI Components and Features
 These and other Azure data services (e.g., Azure SQL Database, Azure HDInsight, Azure Stream Analytics) form the backbone of an Azure BI solution. Together, they ensure that data flows seamlessly from ingestion through processing to visualization, enabling even complex, real-time analytics scenarios.
- Azure Synapse Analytics: A cloud data warehouse and big-data platform in one. Synapse lets you query petabyte-scale data using SQL or Spark and includes built-in integration with Power BI and Azure Machine Learning for advanced analytics.
- Power BI: Microsoft’s industry-leading visualization and BI tool. Power BI connects natively to Azure data sources, enabling users to create interactive dashboards and reports with real-time data. Its familiar interface (Office 365–style) and mobile apps make self-service analytics accessible to all users.
- Azure Data Factory: A fully managed data integration service. Data Factory offers a no-code/low-code interface to ingest, prepare, and transform data at scale. With 90+ built-in connectors (to SaaS apps like Salesforce, on-prem databases, and big data stores), it automates ETL/ELT pipelines and can load data into Azure Synapse or Data Lake for analysis.
- Azure Data Lake Storage: A highly scalable, secure data lake for big data analytics. It provides independent scaling of storage and compute, with automatic geo-replication and enterprise-grade security. Azure Data Lake stores petabytes of data and supports the most common analytics frameworks, letting you process data using Spark (Databricks), SQL (Synapse), or Hadoop technologies, then visualize with Power BI.
- Azure Databricks: An Apache Spark–based analytics platform optimized for Azure. Databricks offers collaborative notebooks for data engineering, streaming analytics, and AI. It is a unified, open analytics platform for building, deploying, sharing, and maintaining enterprise-grade data, analytics, and AI solutions at scale. With Databricks, you can perform large-scale ETL/ELT, run ML workflows, and query your data lake efficiently.
Benefits of Azure Business Intelligence
Azure BI delivers tangible business value by accelerating insights, cutting costs, and improving decision quality. Key benefits include:
Faster Insights & Productivity
Azure BI dramatically reduces time-to-analysis. A Forrester study found organizations achieved 27% faster time-to-insight after adopting Power BI and Azure Analytics. BI tasks that once took hours can now be done in seconds.
Automated data refreshes and built-in AI models (for example, for natural-language Q&A or anomaly detection) save analysts an average of 1.7 hours per week. With Azure’s self-service tools, even non-technical users get immediate answers, so decisions happen in near-real time. One retailer reported moving its daily sales report delivery two hours earlier each morning, significantly improving inventory forecasts.
Lower Total Cost of Ownership
By using Azure’s cloud services, companies eliminate most on-premises data infrastructure costs. The same Forrester research showed Azure Analytics with Power BI produced 25.7% lower TCO compared to legacy solutions. This is due to pay-as-you-go pricing and Microsoft-managed servers (patching, scaling, etc.).
Azure BI also simplifies licensing: Power BI Desktop is free, and end-user pricing is just $10/user/month, in contrast to older BI tools that charged over $1,000 per user. Overall, by moving large portions of BI workloads to Azure, organizations replace millions in fixed costs with a fraction of cloud spend.
High ROI
The combined effect of faster decisions and lower costs translates into a strong return on investment. Microsoft cites a study where Azure Analytics and Power BI delivered 298% ROI over three years. This impressive figure comes from benefits like increased revenues (from acting on insights sooner), reduced operating expenses, and the ability to enter new markets faster. In simple terms, every dollar invested in Azure BI yields multiple dollars back.
Improved Business Performance
Azure BI empowers teams across the organization to optimize operations and strategy. For example, with real-time dashboards, supply chain managers can align procurement with live sales trends, and finance teams can monitor cash flow projections as they happen.
This 360-degree visibility means processes run leaner as businesses using Azure BI operate with optimal operational efficiency, becoming leaner, meaner, and more competitive. In practice, companies see measurable gains from higher sales to lower waste.
Real-time, Actionable Insights
Azure’s integrated BI stack delivers live analytics. Services like Azure Stream Analytics and Event Hubs let organizations process streaming data (IoT device readings, real-time transactions, etc.) and push updates instantly to Power BI dashboards.
This means marketing, operations, or customer service can react the moment data changes. Coupled with AI (for example, sentiment analysis on customer feedback), businesses uncover trends that would otherwise be missed, making their decision-making both faster and smarter.
Data-Driven Culture and Collaboration
By democratizing analytics, Azure BI fosters collaboration. Power BI’s integration with Office 365 and Teams makes it easy to share reports and annotations. Everyone, from executives to frontline staff, can discuss the same data, ask questions, and contribute insights.
In fact, a Harvard Business Review survey found 87% of companies believe analytics proficiency will be a key differentiator. Azure BI delivers on that by putting analytics tools in everyone’s hands. Empowered users and data-literate teams lead to more innovative ideas and strategies across the board.
Scalability and Flexibility
Unlike on-premises BI, Azure scales on demand. You can spin up additional Azure Synapse compute or Databricks clusters during peak workloads, then tear them down to save costs. Storage and compute are decoupled, so huge datasets can be kept without huge bills, and processing power can grow with your needs. This elasticity enables businesses to tackle new analytics projects without bottlenecks, and to only pay for what they use.
Built-in Security and Governance
Azure BI includes enterprise-grade security features. Data at rest is encrypted, access is controlled via Azure Active Directory/RBAC, and all traffic is secured. Microsoft invests heavily in cloud security (over $1B/year and 3,500+ experts).
Additionally, Microsoft Fabric (the new unified analytics platform) provides centralized governance: it automatically applies data sensitivity labels and permissions across all reports and datasets. This ensures that as insights flow to users, compliance requirements (GDPR, HIPAA, etc.) are not an afterthought but built in.
Innovations and Trends in Azure Business Intelligence
Azure BI is evolving rapidly. Major innovations and trends include:
Unified Analytics with Microsoft Fabric
Microsoft’s new Fabric platform unifies all BI capabilities into a seamless SaaS experience. Fabric centralizes data storage (OneLake) and integrates data movement, processing, transformation, real-time analytics, and reporting. In practice, this means users no longer need to manage separate BI services; Power BI, Synapse, Databricks, Data Factory, etc., all appear in one interface.
Fabric also embeds AI at every layer (e.g., Copilot for data analysis, Azure AI Foundry for ML), accelerating insights. For example, Fabric’s AI-enhanced stack can automatically suggest visualizations and generate insights from raw data, reducing manual work.
Augmented Analytics and AI
Azure BI tools increasingly use AI to augment human analysis. Power BI and Databricks support natural-language queries and text-to-SQL features, so business users can ask questions and get answers in plain English. Azure Databricks uses generative AI with the data lakehouse to understand the unique semantics of your data, automatically optimizing performance and even suggesting insights.
Similarly, Power BI’s Q&A feature and AI visuals allow anyone to uncover trends and outliers without coding. This trend, often called “augmented analytics”, makes advanced BI accessible to non-experts and ensures models continuously improve as more data is ingested.
Real-Time and Streaming Analytics
Organizations expect analytics to be instantly up-to-date. Azure is responding by improving support for real-time data. Azure Stream Analytics, Event Hubs, and Fabric’s Real-Time Intelligence workload are examples that handle event-driven data (like IoT signals or social media feeds) end-to-end.
BI dashboards can be configured to update in seconds as new data arrives. This trend enables use cases like fraud detection, connected factory monitoring, and live web analytics, where latency must be minimal.
Data Lakehouse and Governance
The lakehouse architecture is becoming standard. Azure now emphasizes OneLake (a unified data repository) where data is stored once and consumed by any analytic engine. This avoids data silos and simplifies governance.
Built-in tools like Azure Purview unify cataloging and lineage tracking, so companies can manage data quality and compliance at scale. In Fabric, for example, governance is automatic as permissions and labels follow the data across workloads. This trend means businesses can innovate with data faster, without sacrificing security or accuracy.
Self-Service BI Adoption
There’s a strong move towards self-service analytics. Instead of relying on IT teams, business units are taking charge of their BI needs. Azure BI services are evolving to make this easier.
For instance, Fabric’s Data Factory now includes Power Query (Excel-style) interfaces for business users to prep data. Copilot in Power BI can suggest reports. The trend is that average users become analysts, building interactive dashboards on their own. This increases agility and drives a deeper data-driven culture across organizations.
Azure BI for Business Growth and Performance
Azure BI isn’t just about technology; it directly impacts business outcomes. By surfacing actionable insights, it enables growth and performance improvements across departments:
Revenue Growth and Market Expansion
Better analytics opens up new opportunities. Forrester’s study of Azure customers found that enhanced analytics led to millions in increased operating income from revenue growth alone. Insights from Azure BI help identify underserved markets, optimize pricing, and personalize customer engagement.
For example, marketing teams using Azure BI can analyze campaign performance in real time and reallocate budget to the most effective channels, driving higher ROI on marketing spend.
Cost Reduction and Efficiency
At the same time, Azure BI helps cut costs. By optimizing supply chains and operations via data insights, companies reduce waste. Smiths Group, an Azure BI user, reported that the “actionable insights from the data models we’re creating will help us increase revenue, reduce costs, and minimize risk”.
In practice, this could mean forecasting inventory needs more accurately (fewer stockouts or overstocks) or detecting inefficiencies on the factory floor (saving labor and materials).
Optimized Operations
Azure BI boosts operational efficiency. An example cited by Microsoft: store managers began receiving sales reports at 9:00 AM instead of 11:00 AM, giving them two extra hours to adjust staffing and orders each day.
That operational gain, enabled by faster Azure analytics, directly improved planning. Overall, Forrester notes that interviewed organizations saw a 60% improvement in user satisfaction and time savings, reflecting more efficient workflows.
Aligned Strategy and Collaboration
Unified BI aligns teams. When sales, production, finance, and marketing all use the same Azure BI dashboards, everyone’s “on the same page”.
For instance, supply chain and manufacturing can instantly view sales trends to make better procurement decisions, while finance has a real-time, 360° view of cash flows and projections.
This cross-functional visibility means strategic planning is data-informed, and coordinated supply and demand are balanced, budgets are set with real numbers, and risks are spotted early.
Competitive Advantage
Real-time data-driven decision-making is a differentiator. As one industry blog notes, BI “enables business leaders to make insightful, timely, informed decisions” in challenging markets.
Using Azure BI, companies operate leaner and respond faster to change. They become better than competitors at spotting trends, predicting customer behavior, and optimizing processes. In short, Azure BI can shift a company from reactive mode to proactive mode, which often translates to stronger market positioning.
How to Improve Business Strategies with Azure BI
Azure BI also transforms how businesses formulate strategy:
Data-Driven Decision-Making
Executive dashboards from Azure BI platforms are intuitive and visual, letting decision-makers “spot trends, identify potential strengths or weaknesses, and uncover groundbreaking insights with ease”.
For example, a CEO can use Power BI reports to quickly assess the company’s health: Is a product line underperforming? Are margins slipping?
The answers are only a click away and presented as clear charts or KPIs. This level of insight empowers leaders to make strategic adjustments based on solid evidence rather than hunches.
Strategy Formulation
When crafting a long-term strategy, Azure BI provides the necessary data backdrop. Finance can model different scenarios (e.g., “what if” sales forecasts) in Power BI, while analytics teams use Azure Machine Learning in Databricks to predict customer churn or demand.
These advanced insights feed back into strategy sessions as BI and analytics tools provide relevant data, allowing you to spot trends that enable you to make informed decisions swiftly and set actionable milestones. In practice, this might mean using historical sales data to tailor marketing strategy or leveraging operational analytics to plan new production lines.
Collaborative Planning
Azure BI fosters collaboration in strategy meetings. Since dashboards can be embedded in collaboration tools (Teams, SharePoint, etc.), teams can view and discuss the same interactive reports together.
This transparency ensures that marketing plans, budget reviews, and project roadmaps all align with the latest data. For instance, a quarterly business review might feature live Azure BI dashboards showing KPIs, so everyone agrees on the facts before setting goals for the next quarter. This minimizes silos and ensures the strategy reflects actual performance and opportunities.
Continuous Improvement
Finally, Azure BI enables a feedback loop. Strategies produce results, and Azure analytics lets you measure those outcomes precisely (ROI of marketing campaigns, success of operational changes, etc.). Teams can iteratively refine tactics based on what the data shows.
Modern BI platforms even incorporate data storytelling: they make it easy to annotate charts and share narrative insights. This means not only do you have numbers, but also the context and explanation around them, a crucial factor in refining strategy over time.
Unlock Smarter Growth with Azure BI & Folio3
As businesses strive for agility and data-driven decision-making, the impact of Azure Business Intelligence becomes undeniable. From integrating vast data sources to enabling predictive analytics and real-time reporting, Azure BI empowers organizations to move from reactive operations to proactive strategy.
At Folio3, we don’t just implement Azure BI tools; we design intelligent ecosystems tailored to your business needs. As a certified Microsoft Azure Partner, our experts specialize in data integration, warehousing, advanced analytics, and Power BI customization, helping you harness the full potential of Microsoft’s BI stack.
Whether you’re looking to improve operational efficiency, gain real-time business insights, or scale your analytics capabilities, Folio3 is your partner in digital transformation. Let’s turn your data into an asset that drives measurable ROI and sustainable growth.
Contact us today to learn how we can accelerate your business intelligence journey with Azure.