Business intelligence (BI) has emerged as a necessary pillar in all industries. In a world where data is created in milliseconds, organizations not just create data, but they also have the need to extract actionable insights to push the organization towards growth and make the right decision. The appropriate BI tools are able to remodel the raw data into strategic intelligence, enabling companies to remain competitive, to streamline processes, and to foresee future trends.
To guide you on this topic, this article presents the best business intelligence tools in 2025, albeit with a particular focus on those tools that are the best applicable to all types of BI users. No matter what insights, trends, or operational efficiency are desired, the appropriate BI tool may enable you to achieve the desired results.
In the following blog, we will explore the top business intelligence tools, highlight their features, and provide insights into how they can be leveraged to improve data discovery, decision-making, and business outcomes. With the right tools, even beginners can unlock the power of data discovery and put their business on a path to success.
Top 10 Business Intelligence Tools For Data-Driven Decision Making
The list below includes ten of the largest business intelligence platforms in 2025. The list describes both advantages and best applications.
1. Microsoft Power BI
One of the strongest business intelligence solutions, particularly for integrations, AI-enhanced intelligence, and large-scale enterprise adoption. Great if your systems already have the Microsoft stack, as it is easily integrated into the Microsoft ecosystem. Folio3 Azure team gives implementation, support, and consulting services for Power BI.
Features
- AI & Copilot Capabilities that have been rolling out “Copilot” features (“Ask Anything!” etc.) to allow natural language queries, improved language understanding, and semantic model support.
- Rich Data Connectivity and Modeling, which supports many data sources such as SQL, cloud services, on-premises data, ODBC, and BigQuery (preview). Models and semantic layers help standardize definitions.
- Strong reporting & visualization with drag-and-drop dashboards, also custom visuals, mapping, and real-time insights. Frequent feature updates (e.g., visual calculations, Azure Maps enhancements).
- Power BI supports collaboration, security controls, tenant settings, workspace capacity options (Pro, Premium), good for scaling across departments.
2. Tableau
A powerful business intelligence reporting system, well known for its data visualization strength, dashboard storytelling, and widely used in analytics teams. Ideal when compelling, interactive visuals matter.
Features
- Extensive visualization types, drag-and-drop dashboarding, interactive filtering, and storytelling.
- Strong third-party connector support (databases, cloud services, etc.) and ability to embed in user workflows.
- Good sharing, collaboration via Tableau Server or Tableau Online, with controls over permissions and access.
- Advanced analytics features for forecasting, trend lines, parameter controls, etc.
3. SAP Business Objects
A legacy but still highly relevant enterprise-grade business intelligence reporting system, especially for organizations already using SAP ERP / SAP data. Strong for wider organizational reporting and governance.
Features
- Deep integration with SAP backend systems and ERP, strong in reporting, batch scheduling, and financial reports.
- Robust security, role-based access, compliance, and audit trails.
- On-prem and hybrid deployment options.
- Good support for standard reports, dashboards, with a less steep learning curve for SAP users.
4. Sisense
Sisense is reputed to have high-performance and incredibly fast data analysis systems owing to its special data architecture that integrates data preparation, data modelling, and data visualization into one and the same platform.
Features
- Single-stack architecture that combines data preparation, modeling, and visualization in one unified platform for seamless data management.
- In-chip data engine optimized for high-speed data processing, capable of handling large datasets with exceptional performance.
- Intuitive drag-and-drop dashboard builder that allows users of all skill levels to easily create customizable dashboards.
- Integration of AI and machine learning to provide advanced analytical capabilities and enhance data insights and predictions.
5. SAS Augmented Analytics & Business Intelligence
For organizations that need strong advanced analytics, statistical modelling, and predictive insights in addition to dashboards. SAS has a long track record in analytics in regulated and industrial sectors.
Features
- Predictive modelling, forecasting, and machine learning integration within the BI reporting tools.
- Advanced statistical tools, anomaly detection, scenario analysis.
- Strong data preparation, cleaning tools, and handling both structured and semi-structured data.
- Good support for high compliance, auditing, and security needs.
6. Yellowfin BI
A flexible, modern BI platform aimed at dashboards, storytelling, collaboration, and embedded analytics. Good if you want ease of use plus features.
Features
- Dashboard creation, reporting, and “data stories” that guide users through insights.
- Collaboration features with annotations, alerts, and sharing.
- Embedded BI capability to embed dashboards into internal portals or ERP user interfaces.
- Self-service features, so non-technical users can build reports.
7. Looker Studio (Formerly Google Data Studio)
Ideal for teams wanting free or lower-cost dashboards, especially those already using Google Cloud / BigQuery / other Google services. Good for marketing, operations, and finance reporting.
Features
- Over 600 connectors to data sources (Google Analytics, Google Ads, spreadsheets, etc.), free version and “Pro” enterprise tier.
- Easy dashboard and report building, interactive controls, and Google ecosystem integration.
- Customization options, templates, and community gallery.
- Sharing via cloud, real-time updates, good for smaller to medium data volumes.
8. Domo
Domo is an efficient business intelligence tool that caters to real-time analytics of data, and is concentrated on the cloud computing platforms, data pipelines, and executive dashboards.
Features
- Domo includes built-in data ingestion pipelines and ETL capabilities, allowing it to handle data from various sources with customizable refresh schedules.
- It provides real-time dashboards and alerts, along with mobile accessibility so decision-makers can stay informed anywhere, anytime.
- Built-in collaboration and social features, such as commenting and sharing within dashboards, foster teamwork and make it easier to share insights across teams.
- Good visualizations are available, although they may be less customizable compared to platforms like Tableau when it comes to fine-tuning visuals for more complex presentations.
9. Zoho Analytics
Zoho Analytics is a cost-effective and user-friendly business intelligence tool, ideal for small to mid-sized businesses or departments within larger enterprises.
Features
- Zoho Analytics offers affordable pricing, with several tiers designed to fit smaller businesses, allowing users to scale as they grow.
- It features self-service BI reporting tools and an easy drag-and-drop dashboard builder, making it accessible to both business users and analysts.
- The platform supports decent connectors, enabling users to blend data from multiple sources, simplifying data integration across various systems.
- With predictive analytics and forecasting capabilities available in the higher pricing tiers, Zoho Analytics empowers businesses to predict future trends and make data-driven decisions.
10. Qlik Sense
Qlik Sense is a powerful business intelligence tool that focuses on data exploration through association. It enables users to interactively view and process data without being confined to pre-made queries.
Features
- The platform’s associative engine enables users to dynamically explore relationships in data, uncovering insights that might be hidden in traditional linear query models.
- High performance makes Qlik Sense suitable for large datasets, allowing users to easily drill down into data to analyze trends and correlations.
- Qlik Sense offers a combination of guided and self-service BI reporting tools, empowering both business users and technical experts to create and access reports at their convenience.
- The platform also prioritizes strong governance and security features, ensuring that sensitive data is protected, and it provides support for embedded analytics, enabling businesses to integrate Qlik Sense reports within other applications.
Key Factors to Consider When Selecting the Best Business Intelligence Tool
The key to selecting appropriate business intelligence software is not to select the most popular name, but rather to select the tool that suits you.
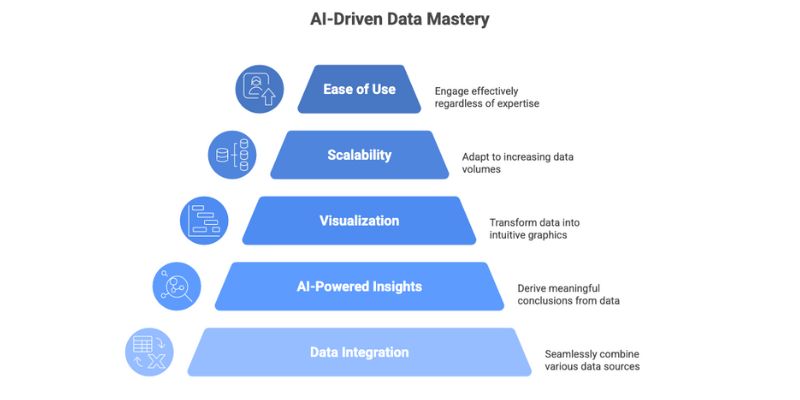
1. Ease of Use
When choosing a business intelligence (BI) tool, it must be easy to use, particularly when one has a mixed workforce like finance, operations, and supply chain employees, rather than only data scientists. Intuitive and easy-to-navigate dashboards should be provided by the tool so that non-technical users can be able to access and comprehend important insights easily.
2. Integration Capabilities
One of the major considerations that should be made in the selection of a BI tool is its integration capabilities. The platform that you are going to have must be able to integrate with your current systems, such as ERP, MES, SCM, inventory, CRM, and financial systems, to allow data to flow easily throughout your processes. The tool must be in a position to draw information through various sources, which can include on-premises systems, cloud services, and streaming information. It is also significant that the tool has API support and ready-made connectors to allow easy integration with other data sources.
3. Pricing and Scalability
Pricing and scalability are critical considerations, particularly for mid-to-large businesses. The costs of BI tools can quickly add up as data volume increases, whether it’s per user, based on capacity, or usage-based. It is essential to manage costs effectively. Be aware of potential hidden costs such as additional fees for storage, data refresh rates, and extra connectors that may be required as your data ecosystem expands. Scalability is also vital, as your tool should be able to handle growing data volumes and accommodate more users without performance issues.
Conclusion
The best business intelligence technologies in 2025 are not only related to dashboards. They are complete business intelligence platforms, which integrate mature reporting, real-time analytics, AI-assistance, high security and integration, and user-friendly interfaces.
When evaluating tools for business intelligence software, compare their ease of use, integration capabilities, and total cost (both upfront and ongoing). For businesses seeking advanced BI tools integrated with their ERP systems, exploring options like Azure BI Solutions at Folio3 can help provide the right platform that aligns with your data needs.