
Retail Data Analytics: Pre-Built Reporting Dashboards on Azure
Sales, inventory, store and customer performance in one governed view. Folio3's retail data analytics dashboards run on Microsoft Fabric and Power BI, connect to Dynamics 365, POS and e-commerce data, and go live in weeks instead of quarters.
- Microsoft Solution Partner – Data & AI
- 200+ certified experts
- 1,000+ clients worldwide
What Is Retail Data Analytics?
Retail data analytics is the practice of combining sales, inventory, store, supply-chain and customer data into a single model so that merchandising, operations and finance teams can measure performance and act on it. On Microsoft Azure it typically means landing data from ERP, POS and e-commerce systems in a Fabric lakehouse, modelling it in Power BI, and surfacing it as role-based dashboards.
A retail analytics dashboard is the delivery layer: a set of Power BI reports that track retail KPIs such as net sales, gross margin, sell-through, stock cover, basket size and store traffic, refreshed automatically from source systems. Pre-built dashboards ship with the data model, KPIs and visuals already defined, so the work shrinks to connecting your sources and adjusting labels and hierarchies.
Why Retailers Choose Pre-Built Dashboards Over Custom BI Projects
Most retailers do not lack data. They lack a usable, trusted version of it. Typical symptoms we see before an engagement:
- Month-end sales and margin reporting assembled by hand from ERP exports and POS extracts.
- Store managers working from spreadsheets that lag the business by days.
- Inventory, e-commerce and loyalty data living in separate tools with no common product or customer key.
- A Power BI estate that grew report by report and now has no governance.
Pre-built retail reporting dashboards remove the twelve-to-twenty-week build that a custom BI project needs before anyone sees a number. The data model and KPIs are standard retail; what is unique to you is the data mapping and the hierarchies, and that is where the implementation time goes. The dashboards are part of IntelliFabric, Folio3's industry-ready analytics solution built on Microsoft Fabric, so the same governed architecture serves finance, operations and merchandising.
Manual Reporting vs Pre-Built Dashboards: What Changes Day to Day
| Task | Before: manual reporting | After: pre-built dashboards |
|---|---|---|
| Month-end sales and margin | 3–5 days of ERP and POS exports stitched in Excel. | Available on day 1 from the refreshed Retail Sales Overview dashboard. |
| Store manager view | A weekly PDF or spreadsheet, often 2–7 days stale. | A same-day Store Performance dashboard, limited to each manager's stores. |
| Sources joined | Sales and inventory in separate files, customer data rarely joined. | ERP, POS, e-commerce and loyalty data conformed on shared product, store and customer keys. |
| Refresh | On request, when an analyst has time. | Scheduled daily by default, hourly for POS where needed. |
| Who builds reports | One or two analysts and a queue for every new ask. | Business users self-serve on governed semantic models; analysts add new measures. |
| KPI definitions | Different in every spreadsheet and region. | One definition per KPI, stored in the semantic model and documented. |
| Audit and lineage | None. | Every number traces to its source table through Fabric lineage. |
| Mobile access | Not available. | Phone layouts for every dashboard. |
The Power BI Retail Dashboards Included
Seven retail reporting dashboards ship in the pack, all on one shared retail data model.
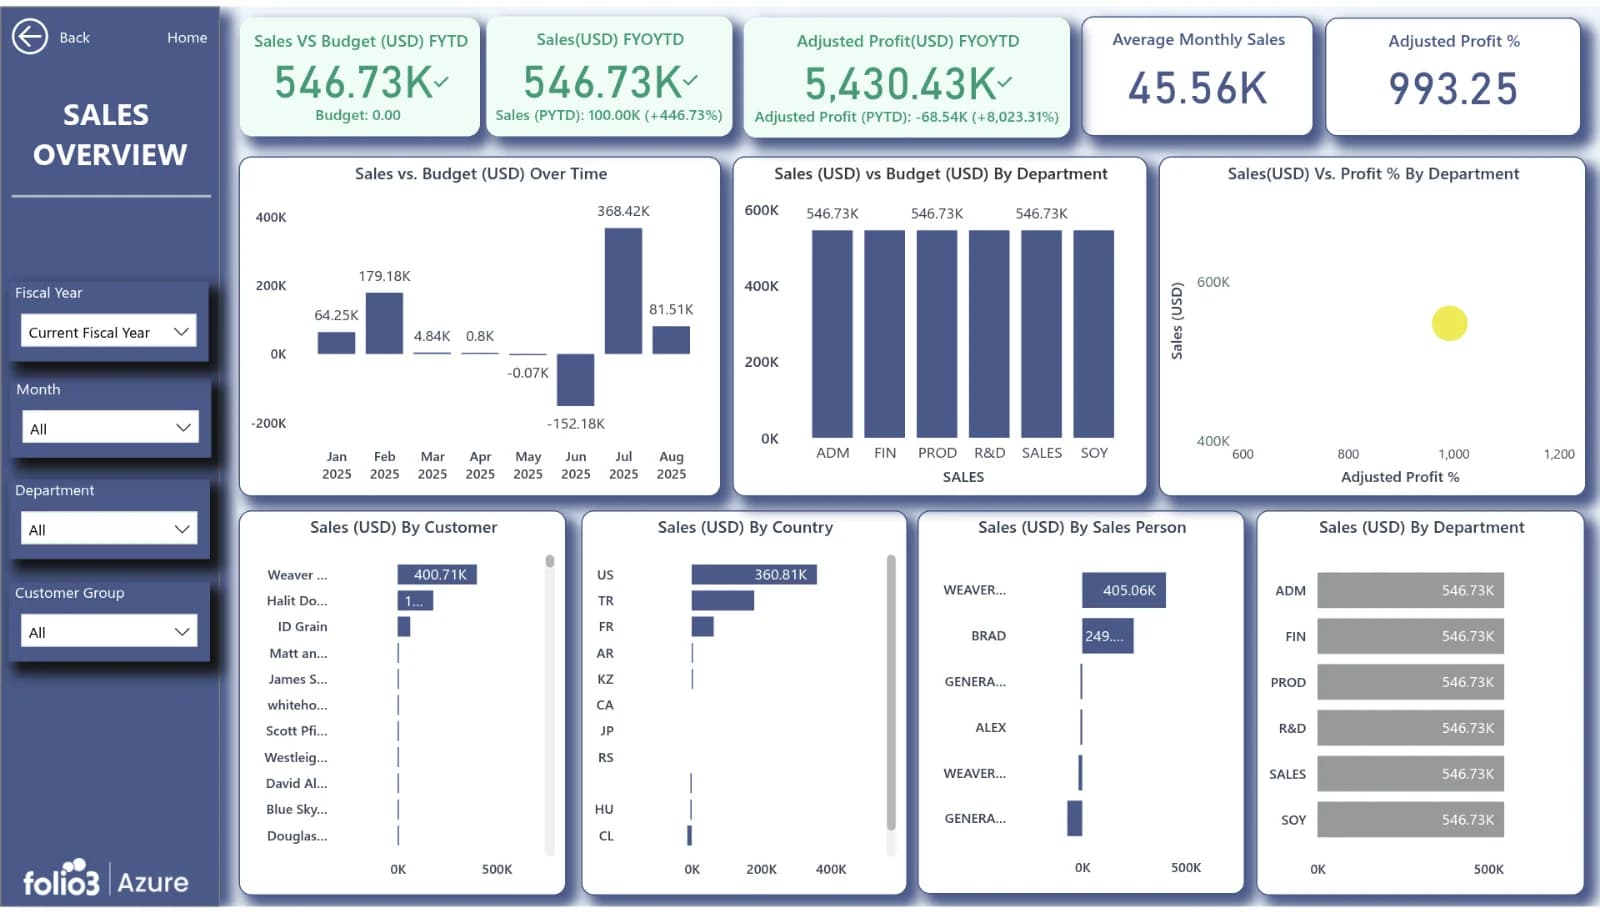
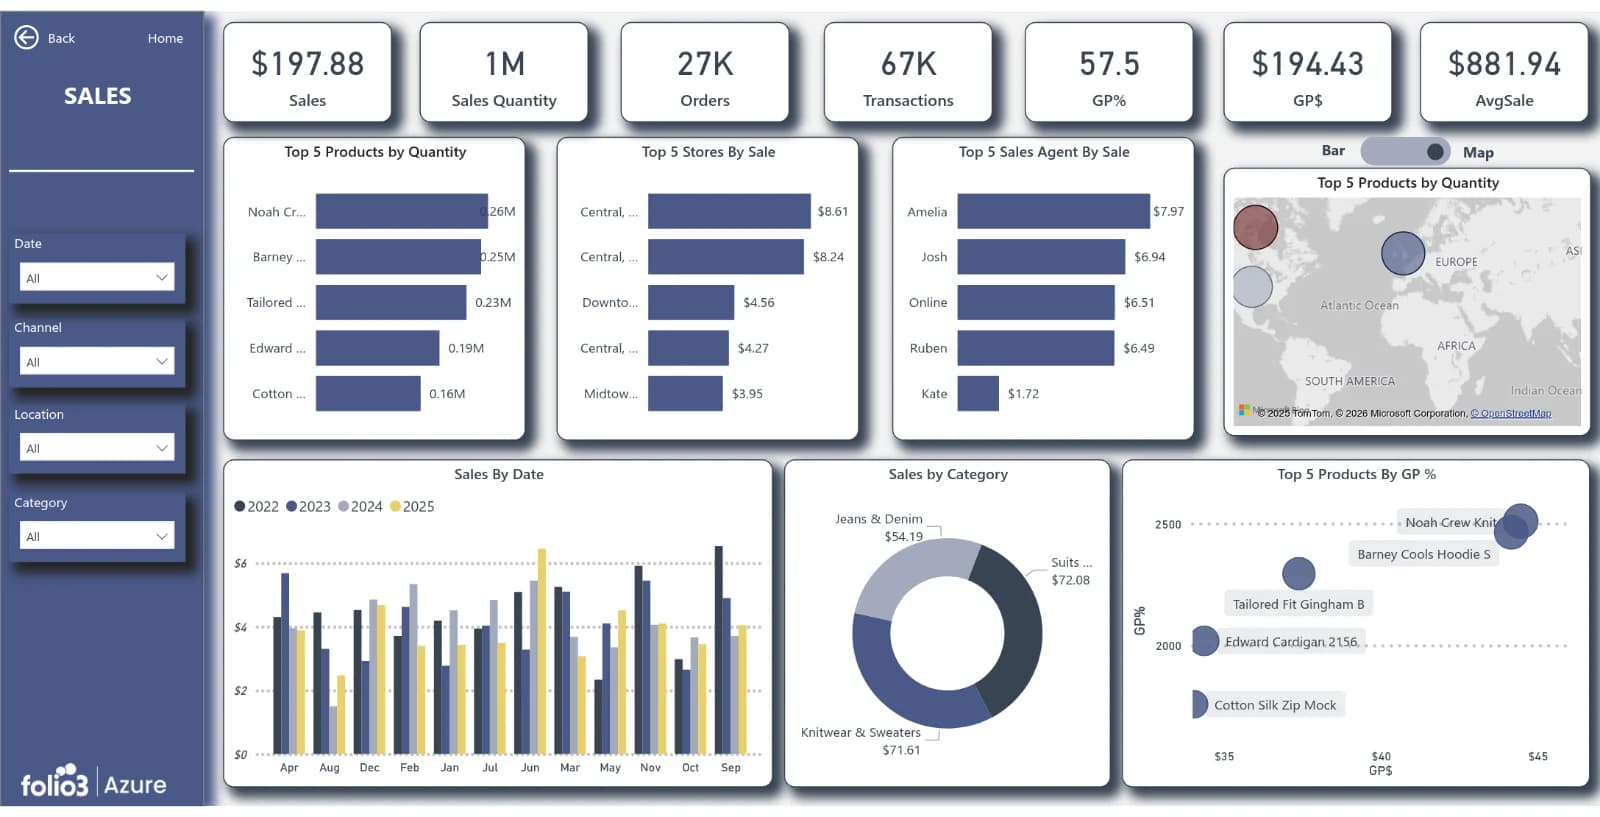
Retail Sales Overview
- KPIs and views
- Net sales, gross margin, units, YoY and LY comparisons, sales by store/region/channel/category, hourly and daily sales patterns
- Primary users
- CEO, CFO, head of sales
- Typical sources
- D365 Business Central/F&O, POS, e-commerce
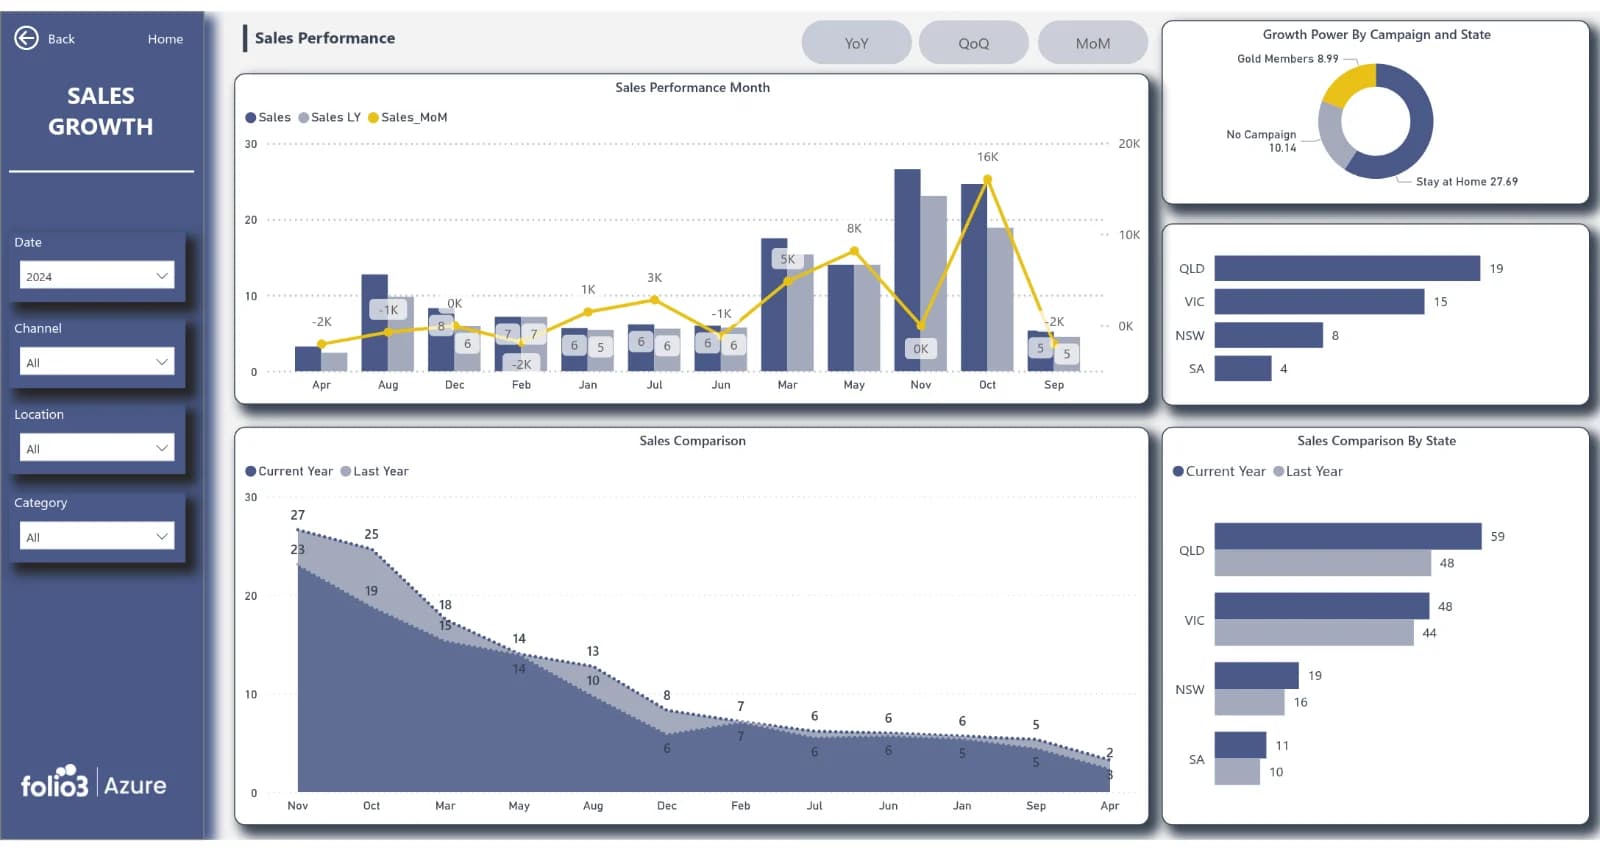
Store Performance
- KPIs and views
- Sales per store and per square foot, conversion, average transaction value, basket size, top and bottom stores, staff sales
- Primary users
- Regional and store managers
- Typical sources
- POS, workforce/scheduling
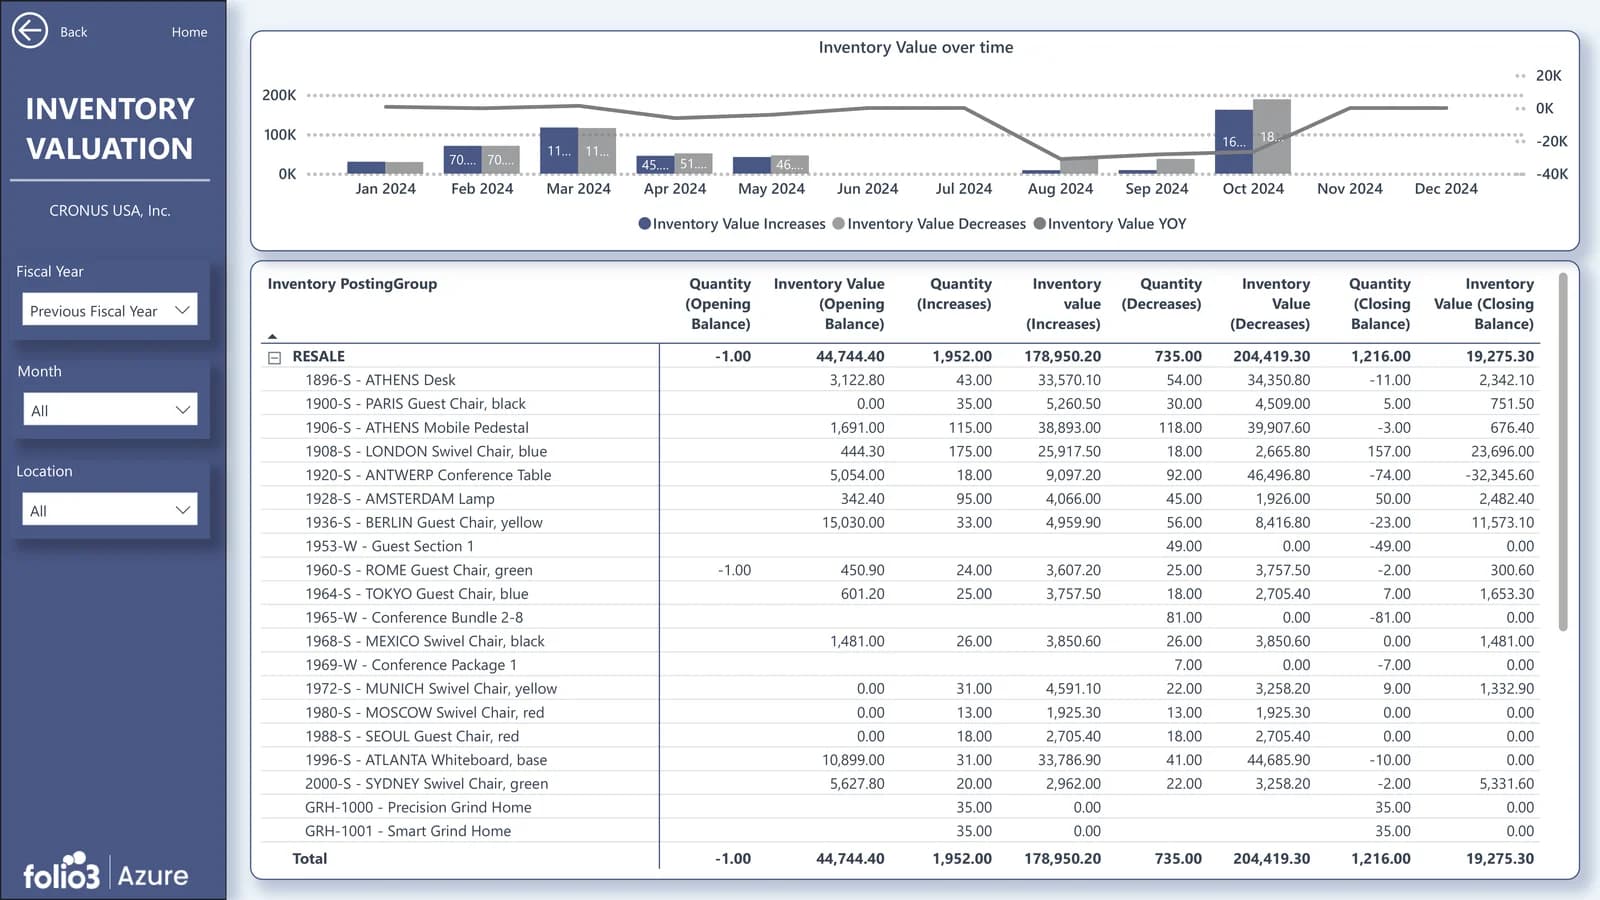
Inventory & Stock Health
- KPIs and views
- Stock on hand, stock cover (days), sell-through %, ageing stock, out-of-stock and overstock alerts, inventory turnover by SKU/category
- Primary users
- Merchandising, supply chain
- Typical sources
- ERP inventory, WMS
Product & Category Performance
- KPIs and views
- Category contribution, margin mix, price-band analysis, new-product tracking, markdown impact
- Primary users
- Merchandising, buying
- Typical sources
- ERP, POS
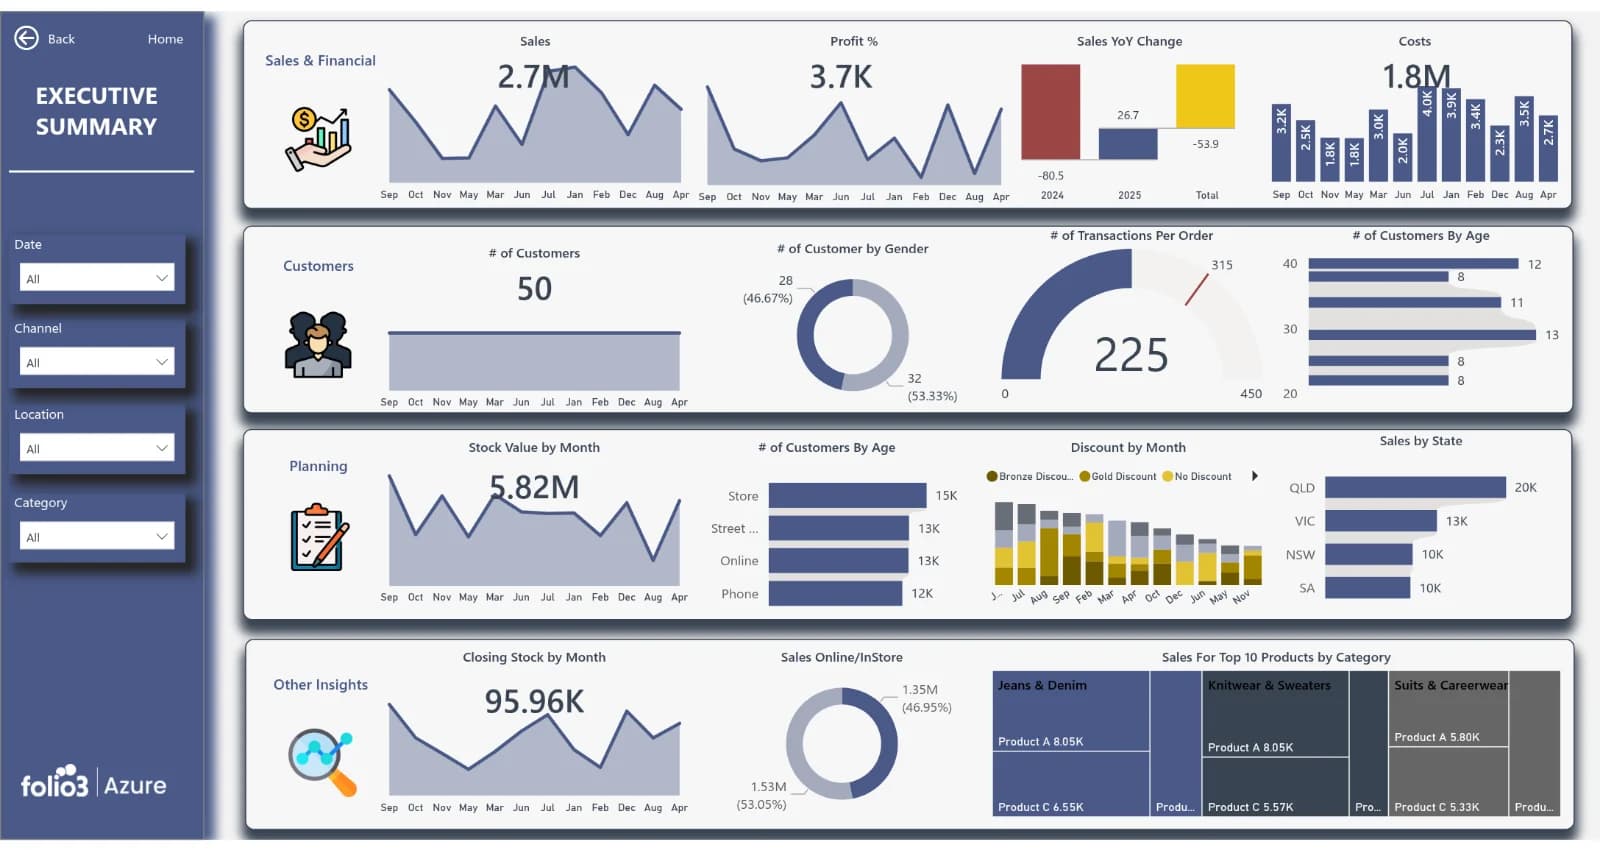
Customer & Basket Analytics
- KPIs and views
- Repeat-purchase rate, customer lifetime value, basket composition, market-basket affinities, loyalty segment performance
- Primary users
- Marketing, CRM
- Typical sources
- POS, e-commerce, loyalty/CRM
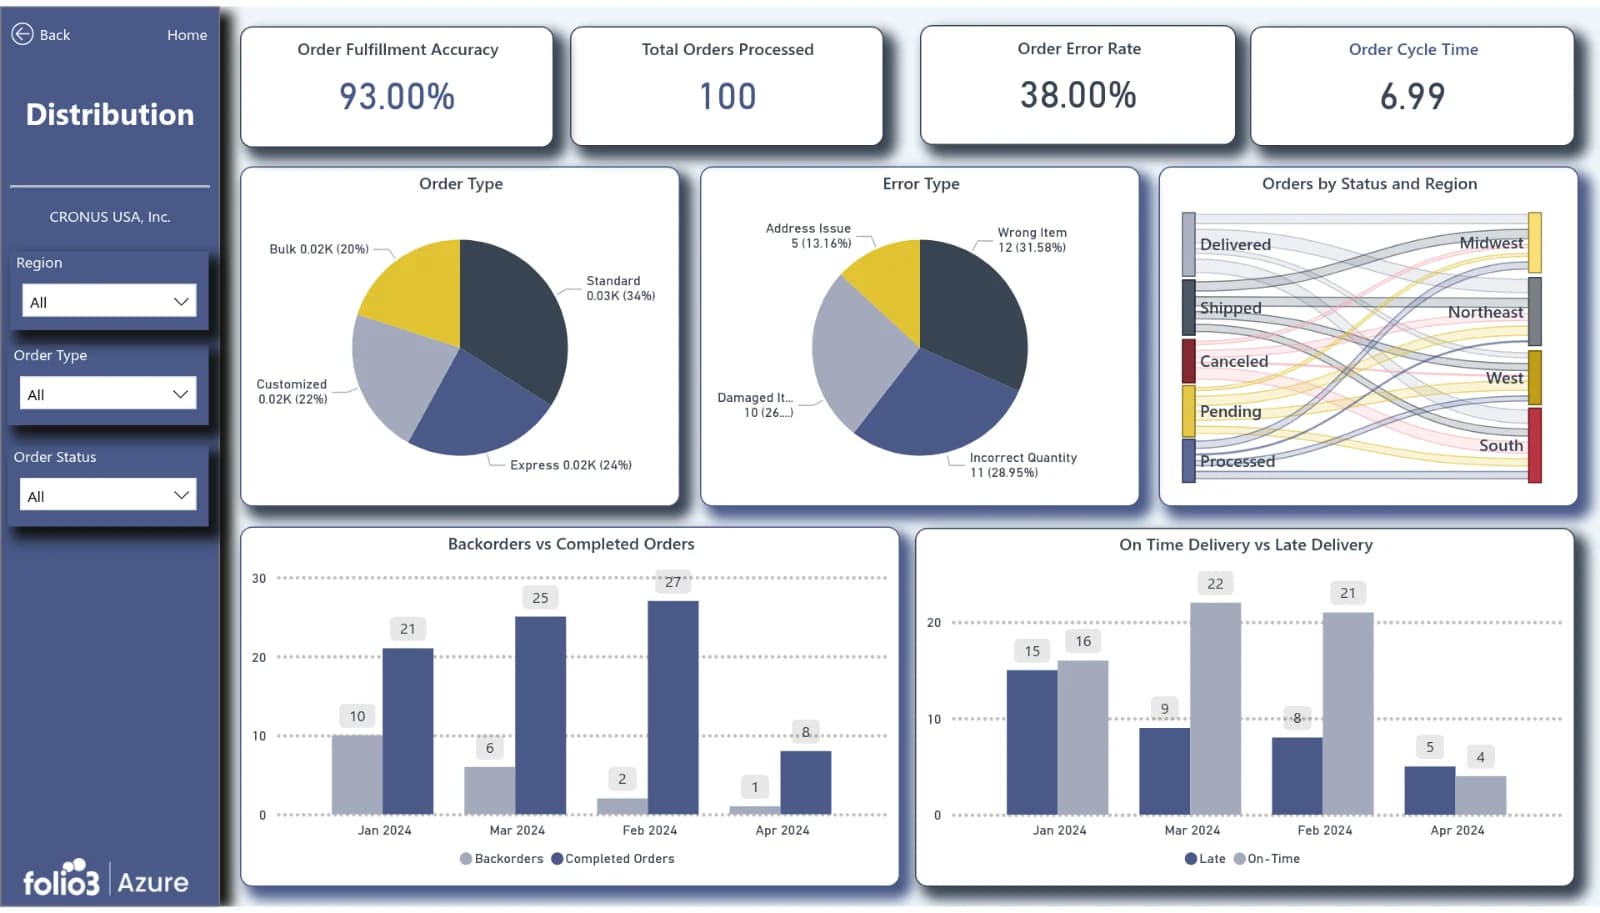
E-commerce & Omnichannel
- KPIs and views
- Online vs store sales, order funnel, returns rate, fulfilment lead time, click-and-collect share
- Primary users
- E-commerce, operations
- Typical sources
- Shopify/Magento/other storefronts, OMS
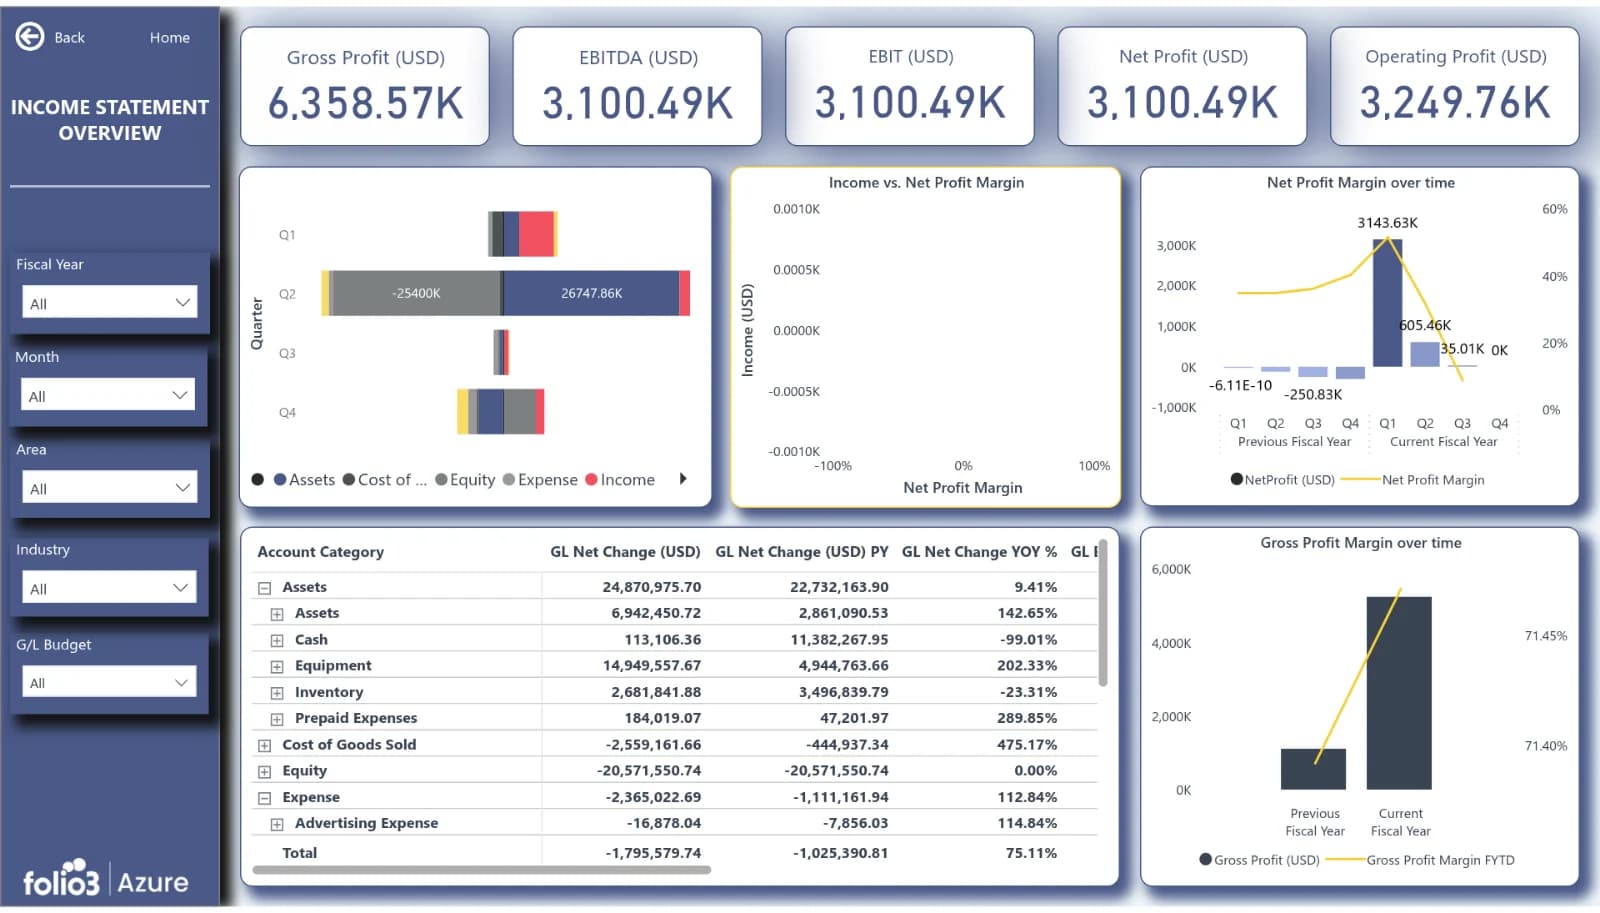
Finance for Retail
- KPIs and views
- P&L by store and channel, cost of goods, operating expense ratios, cash and receivables
- Primary users
- CFO, controllers
- Typical sources
- D365 Business Central/F&O
Every dashboard includes scheduled refresh, mobile layouts and drill-through to transaction detail; security and governance are covered below. Retailers already running Dynamics 365 Business Central can start from the Business Central dashboards suite and add the retail-specific views on top.
Built for Every Retail Format
The same data model and dashboards are configured differently by format. Hierarchies, KPI emphasis and alert thresholds change; the architecture does not.
Fashion and apparel
- Emphasis
- Sell-through by style, colour and size; markdown timing; season and drop performance.
- Dashboards used
- Product & Category Performance, Inventory & Stock Health, Retail Sales Overview.
- Extra views
- Size-curve analysis, aged-stock markdown planner.
Grocery and convenience
- Emphasis
- Hourly and daily sales, basket size, waste and shrink, promotion lift.
- Dashboards used
- Store Performance, Customer & Basket Analytics, Inventory & Stock Health.
- Extra views
- Hourly sales heatmap, promo uplift vs baseline, waste by category.
Specialty and multi-brand
- Emphasis
- Category and brand contribution, margin mix, supplier performance.
- Dashboards used
- Product & Category Performance, Finance for Retail.
- Extra views
- Brand scorecard, supplier fill-rate and lead-time view.
Franchise and multi-entity networks
- Emphasis
- Like-for-like store comparison, royalty and fee reporting, franchisee compliance.
- Dashboards used
- Store Performance, Finance for Retail.
- Extra views
- Franchisee-restricted dashboards with row-level security per entity.
Omnichannel and DTC brands
- Emphasis
- Channel mix, online returns, fulfilment lead time, customer lifetime value.
- Dashboards used
- E-commerce & Omnichannel, Customer & Basket Analytics.
- Extra views
- Order funnel, click-and-collect share, cohort retention.
Consumer goods selling through retailers
- Emphasis
- Sell-in vs sell-out, retailer scorecards, distribution gaps.
- Dashboards used
- Retail Sales Overview, Inventory & Stock Health.
- Extra views
- Retailer POS data pipelines, out-of-stock by account.
Format-specific configuration is scoped in the discovery workshop and is included in the standard engagement.
Retail Analytics on Microsoft Fabric and Power BI
- 1
Sources
D365 BC/F&O, POS, e-commerce, loyalty, WMS, Excel
- 2
Fabric Data Factory
Pipelines ingest each source on a schedule
- 3
OneLake lakehouse
Bronze, Silver and Gold layers; Gold holds the conformed retail model
- 4
Power BI semantic models
Direct Lake connectivity, certified KPI definitions
- 5
Role-based dashboards
Head office, regions and stores, each with their own view
- 6
Copilot and alerts
Stock, pricing and staffing alerts on the same data
The retail pack runs on a medallion-architecture lakehouse in Microsoft Fabric. Data Factory pipelines ingest source systems into OneLake, a Gold layer holds the conformed retail model (product, store, customer, transaction, inventory and promotion entities aligned to Microsoft's retail industry data model), and Power BI semantic models sit on top with Direct Lake connectivity. The result is one governed copy of the data that serves dashboards, ad-hoc analysis and AI workloads. Our Microsoft Fabric services team handles the platform build, migration from legacy warehouses and capacity sizing.
If you are not yet on Fabric, the same dashboards deploy on Azure Synapse or Azure SQL with Power BI Premium, and migrate to Fabric later without rebuilding reports.
Connects to the Systems Retailers Already Run
ERP
 Dynamics 365 Business Central
- Dynamics 365 Finance & Operations
- Dynamics 365 Commerce
- NetSuite
POS and retail management
- LS Central
- Dynamics 365 Commerce POS
- Lightspeed
 Square
- Custom POS via SQL or API
E-commerce
 Shopify
 Magento/Adobe Commerce
 BigCommerce
 WooCommerce
Customer and marketing
- Dynamics 365 Customer Insights
 Salesforce
 HubSpot
- Loyalty platforms
Files and legacy
 Excel
- CSV
- SFTP drops
 On-premises SQL Server
Security, Governance and Licensing
Your data stays in your Azure tenant. Folio3 deploys the lakehouse, pipelines and Power BI workspaces into your subscription, and you hold the admin rights from day one.




- Access control: row-level security by store, region, entity and role; object-level security for sensitive measures such as margin and cost of goods; Microsoft Entra ID groups drive all permissions.
- Governance: Microsoft Purview lineage and sensitivity labels on the Fabric lakehouse; certified semantic models so business users build on one approved dataset.
- Data residency and compliance: deployed in the Azure region you choose; supports retailers' PCI-DSS scoping by keeping cardholder data out of the analytics layer and GDPR obligations through pseudonymised customer keys.
- Operations: pipeline monitoring, refresh failure alerts and capacity usage reports handed to your team or run under Folio3 managed services.
- Licensing: Microsoft Fabric capacity (F-SKUs) and Power BI Pro or Premium Per User licences are purchased through Folio3 as a Direct (Tier 1) Cloud Solution Provider or through your existing Enterprise Agreement; we size capacity during discovery so you are not over-licensed at launch.
What the Engagement Looks Like
- Week 1
01. Discovery
30-minute call, then a half-day workshop to confirm sources, hierarchies and the KPI definitions your finance team already uses.
- Weeks 2–4
02. Connect and model
Pipelines built, retail data model populated, data validated against your month-end numbers.
- Weeks 4–6
03. Configure dashboards
Pre-built reports mapped to your hierarchies, branding applied, row-level security set, user acceptance testing.
- Weeks 6–8
04. Go live and enable
Rollout to store and head-office users, training, handover to your BI team or to Folio3 Azure managed services for ongoing support.
A single-ERP retailer with one POS and one storefront is typically live in six weeks. Multi-country or multi-ERP estates run eight to twelve.
Customise, Extend, and Add AI
The dashboards are a starting point, not a cage. Our Power BI services team adds company-specific KPIs, new report pages, planning and budgeting views, and embedded analytics for suppliers or franchisees. Because the data lives in a governed Fabric lakehouse, you can layer on demand forecasting, markdown optimisation or an operational Copilot in Retail agent that watches the same data and raises stock, pricing and staffing alerts automatically.
Pre-Built Pack vs Custom Build vs Microsoft's Free Sample
Retailers usually weigh three options. The table shows where each fits.
| Criterion | Microsoft Retail Analysis sample | Custom Power BI build | Folio3 pre-built retail pack |
|---|---|---|---|
| What it is | Free demo report with fictional store data (Microsoft Learn) | Reports designed and built from scratch on your data | Retail data model, pipelines and seven dashboards deployed on your data |
| Time to first live dashboard | Minutes, but on sample data only | 12–20 weeks | 6–8 weeks |
| Data model | Single flat table; no connection to real systems | Designed per project; quality depends on the team | Conformed retail model aligned to Microsoft's retail industry data model |
| Source connectivity | None | Built per source | Existing pipelines for Dynamics 365, POS, e-commerce and CRM |
| Governance and security | None | Added if scoped | Row-level security, Purview lineage, certified models included |
| Ongoing support | None | Internal team or retained consultancy | Optional Folio3 managed services |
| Cost band | Free | Highest; largely design and discovery hours | Fixed-price implementation; licences via CSP |
| Best for | Learning Power BI | Highly unusual data models or bespoke planning tools | Retailers on the Microsoft stack who want trusted numbers quickly |
Many retailers start with the sample to see what Power BI can do, then discover the real work is the data model and pipelines, which is exactly what the pre-built pack supplies.
Why Folio3 for Retail Data Analytics
Among retail data analytics companies, Folio3 covers ERP, data platform, BI and AI under one Microsoft partnership, so your retail analytics solutions come from a single team.
Book a discovery call- Microsoft Solution Partner with designations in Data & AI, Infrastructure, Digital & App Innovation and Business Applications, and a Direct (Tier 1) Cloud Solution Provider.
- One partner across the stack: ERP (Dynamics 365), data platform (Azure and Fabric), BI (Power BI) and AI (Azure OpenAI, Copilot).
- Retail and consumer-goods delivery record: Power BI financial reporting for Alibaba, IntelliFabric dashboards for Weaver Popcorn Hybrids, plus Dynamics 365 retail implementations across North America, the UK and the Middle East.
- 200+ Microsoft-certified experts and 24/7 support, so the dashboards keep running after the project ends.
- Industry framing, not generic BI: the retail pack is one of several industry solutions under our Azure for Retail practice.
See Your Retail Numbers in a Working Dashboard
Bring a sample sales or inventory extract to a 30-minute discovery call and we will show it in the Retail Sales Overview dashboard. If you are planning a move to Microsoft Fabric, ask for the complimentary Fabric readiness assessment.
Frequently Asked Questions
What is retail data analytics?
Retail data analytics is the use of sales, inventory, store, customer and supply-chain data to measure retail performance and guide merchandising, pricing, staffing and stock decisions. It spans descriptive reporting (what sold), diagnostic analysis (why margin moved), and predictive models (what demand will be).
What KPIs should a retail dashboard track?
At minimum: net sales, gross margin and margin %, units sold, average transaction value, basket size, conversion rate, sales per square foot, sell-through %, stock cover in days, inventory turnover, out-of-stock rate, returns rate and customer repeat-purchase rate. Folio3's pre-built dashboards include all of these plus category, store and channel breakdowns.
How long does it take to deploy pre-built retail dashboards?
Six to eight weeks for a single ERP, POS and storefront; eight to twelve weeks for multi-entity or multi-ERP estates. The pre-built data model and reports remove the design phase; time goes into source connections and validation.
Do I need Microsoft Fabric, or will Power BI alone work?
Power BI alone works for small estates with one or two sources. Microsoft Fabric adds the lakehouse, pipelines and governance needed once you combine ERP, POS, e-commerce and loyalty data or want AI on top. Folio3 deploys on either and migrates Power BI-only estates to Fabric without rebuilding reports.
Which systems can the dashboards connect to?
Dynamics 365 Business Central, Finance & Operations and Commerce, LS Central, NetSuite, Shopify, Magento, BigCommerce, Salesforce, HubSpot, SQL Server and flat files are covered by existing pipelines. Other systems are connected through Data Factory in the first sprint.
Are the dashboards customisable?
Yes. Hierarchies, KPI definitions, branding and security are configured in every deployment, and new report pages or KPIs are added by our Power BI team. You own the Power BI files and the Fabric workspace.
How much do pre-built retail dashboards cost?
Pricing depends on the number of source systems, entities and users. A fixed-price implementation is quoted after the discovery workshop, with optional managed-services support billed monthly. Fabric capacity and Power BI licences are purchased through Folio3 as a Direct CSP or through your existing Microsoft agreement.
Is this software or a service?
Both. You receive the pre-built dashboards, data model and pipelines as deployable assets in your own Azure tenant, delivered and configured by Folio3 as a project. There is no third-party SaaS layer between your data and your users.
Talk to an Azure engineer
Let's talk about your Azure project.
Schedule a 1:1 Call Today
Get in touch with our team to solve your Azure queries.