Microsoft Fabric ERP reporting turns transactional ERP data into governed, scalable analytics for finance, operations, supply chain, and executive teams. Instead of forcing the ERP to answer every analytical question, ERP reporting with Microsoft Fabric adds a dedicated data and BI layer. There, ERP, CRM, warehouse, eCommerce, planning, and external data are prepared, modeled, secured, and analyzed together.
For Dynamics 365, Business Central, and other ERP environments, the goal is a reporting foundation that reconciles to the general ledger, keeps KPIs consistent, protects sensitive data, and answers business questions quickly without slowing the transactional system.
Quick answer: Use Microsoft Fabric for ERP reporting when native ERP reports and spreadsheets can no longer support cross-functional analytics, repeatable KPIs, multi-entity visibility, self-service at scale, or timely executive reporting. Keep the ERP as the system of record, and use Fabric as the governed analytics layer.
What is Microsoft Fabric ERP reporting?
Microsoft Fabric ERP reporting is the practice of using Fabric’s data integration, engineering, warehousing, governance, and Power BI capabilities to analyze ERP data at scale. It makes financial and operational ERP data available in a controlled analytics environment, where teams can combine it with other business data and build reusable reporting models.
A typical solution brings data from Dynamics 365 Finance and Supply Chain Management, Business Central, CRM, warehouse management, eCommerce, and spreadsheets into OneLake. Teams then transform it, build a Lakehouse or Warehouse model, define shared business measures, and deliver role-specific Power BI reports.
| System | Primary purpose | Typical output |
|---|---|---|
| ERP | Execute and record business transactions | Orders, invoices, inventory movements, journal entries, approvals, statutory reports |
| Microsoft Fabric | Integrate, model, govern, and analyze data | Executive dashboards, cross-functional KPIs, trend analysis, forecasting, anomaly detection, self-service BI |
| Power BI semantic model | Define reusable business logic and secure access | Certified measures and consistent revenue, margin, inventory, and cash-flow calculations |
This split mirrors how Microsoft frames the relationship. A Microsoft Fabric blog post on Business Central integration notes that Business Central and Fabric are designed for different types of workloads: the ERP runs transactions, and Fabric runs analytics.
When native ERP reporting is no longer enough
Native ERP reports remain the right tool for operational, transactional, and statutory outputs. The need for Fabric usually starts when leaders need answers that cross data domains, legal entities, systems, or time periods.
You are likely ready for Microsoft Fabric ERP reporting when one or more of these apply:
- Finance spends days consolidating spreadsheets at month-end.
- ERP reports run slowly or degrade the experience for transactional users.
- Departments publish conflicting versions of revenue, margin, inventory, or customer metrics.
- Leaders need a combined view of ERP, CRM, eCommerce, warehouse, supplier, and planning data.
- Users need drill-through analysis beyond the standard ERP reporting experience.
- Multi-company, multi-currency, or multi-region reporting depends on manual effort.
- Power BI usage is growing, but datasets, measures, refresh schedules, and access rules are unmanaged.
- The business wants forecasting, anomaly detection, AI-assisted analysis, or operational alerts.
Folio3’s Analytics Modernization Assessment is built for this decision point. It evaluates data sources, pipelines, reporting assets, governance, workload readiness, capacity needs, and migration priorities before you commit to a Fabric rollout.
A reference architecture for ERP reporting in Fabric
The right design depends on your ERP product, data volume, freshness needs, customization level, security obligations, and audience. A durable pattern for OneLake ERP analytics usually has six layers:
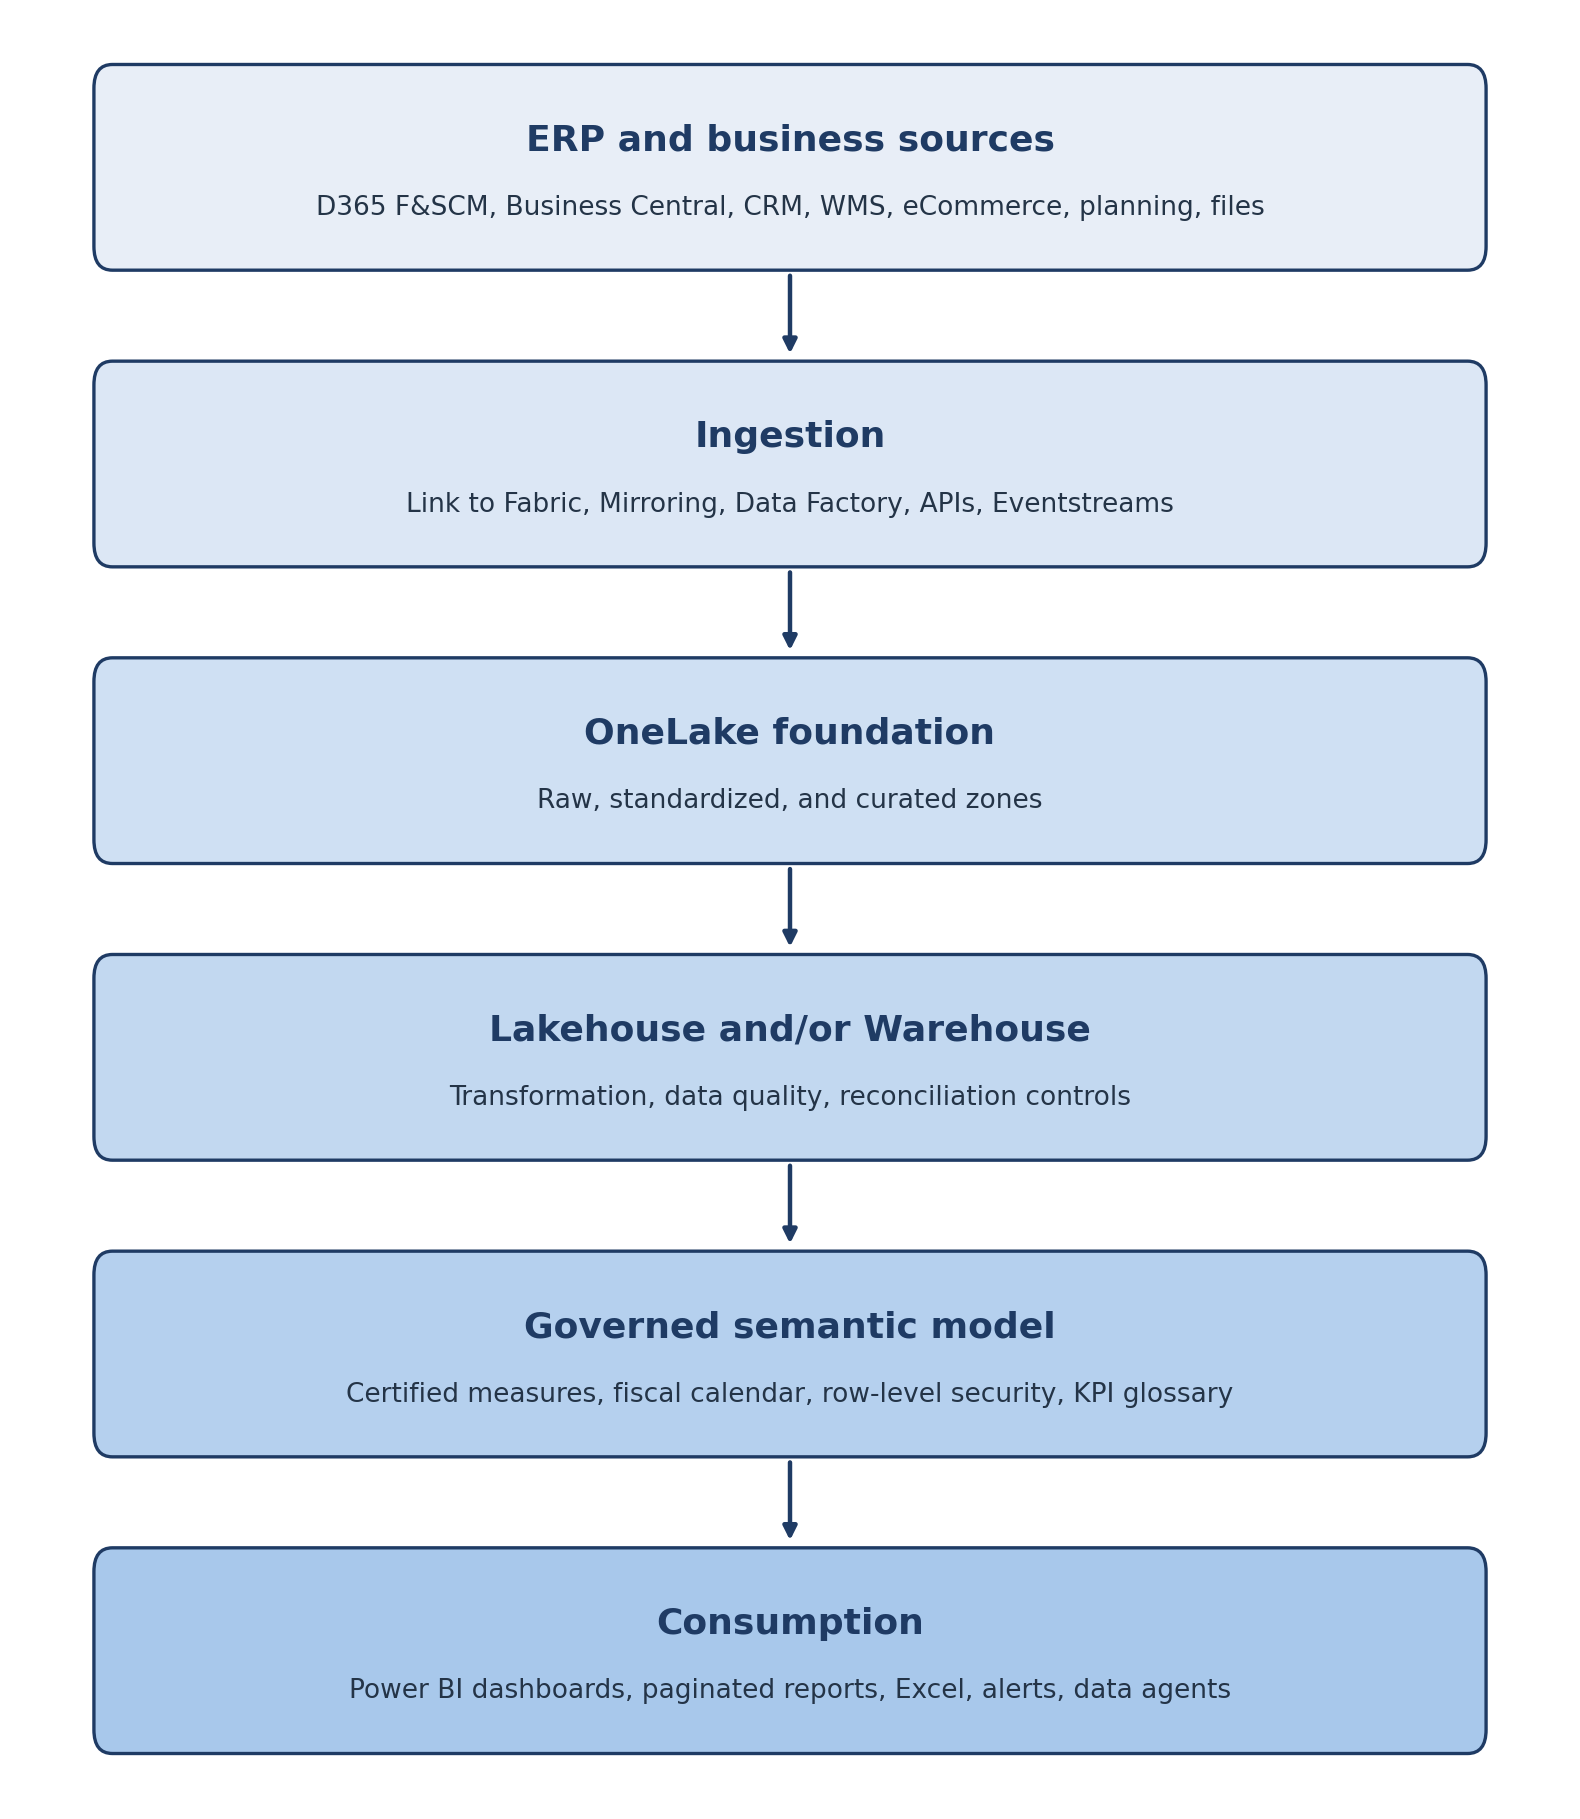
Data moves top to bottom once, and every report, dashboard, and agent reads from the same governed model.
1. Ingest without disrupting ERP operations
Keep the ERP optimized for transactions. Use supported replication, APIs, and read-only access patterns so the production ERP never becomes a reporting engine. The main ingestion options differ by source:
| Source | Common ingestion option | What to know |
|---|---|---|
| Dynamics 365 Finance and Supply Chain Management, Dynamics 365 CE apps | Link to Microsoft Fabric (Dataverse) | Makes selected Dataverse and finance and operations tables available in OneLake without custom ETL pipelines |
| Business Central | Business Central APIs through Data Factory, or partner Open Mirroring workloads | Business Central does not run on Dataverse, so Link to Fabric does not apply |
| Operational databases (for example, Azure SQL) | Fabric Mirroring | Continuous replication into OneLake in Delta format |
| Files, SaaS apps, planning tools | Data Factory pipelines and dataflows | Schedule-based; add load timestamps for auditability |
| Machines, IoT, event sources | Eventstreams (Real-Time Intelligence) | Use only where seconds-level freshness changes a decision |
For Business Central, one example is the partner BC2Fab workload, which Microsoft’s Fabric blog describes as replicating Business Central data into OneLake through Open Mirroring. Once data lands in OneLake, Fabric workloads can use it without extra copies for each use case. The principle applies to every source: collect once, govern centrally, and serve many analytical needs from that foundation.
For step-by-step integration guidance, see our guide to integrating Microsoft Fabric with ERP systems.
2. Separate raw, standardized, and curated data
Do not build executive dashboards directly on raw ERP tables. A layered approach keeps source traceability while producing analytics-ready models:
- Raw: source-aligned ERP extracts with load timestamps and audit fields.
- Standardized: cleaned dimensions, mapped company codes, normalized currencies, harmonized dates, and validated identifiers.
- Curated: reporting-ready facts and dimensions, finance reconciliation tables, and shared entities such as customer, product, order, inventory, supplier, and legal entity.
3. Use a semantic model as the reporting contract
The semantic model is where a reporting program becomes reliable. It defines shared calculations, fiscal calendars, hierarchies, relationships, security rules, and KPI definitions.
Gross margin, for example, should be calculated once. The same certified measure should serve the sales dashboard, the finance dashboard, and the executive report, with documented logic and controlled change management.
Folio3’s Cloud Data Modernization services cover this full path, from ingestion and OneLake architecture to Lakehouse or Warehouse design, semantic modeling, dashboards, governance, and ongoing optimization.
Advanced ERP reporting strategies
Build finance reporting that finance can trust
Microsoft Fabric financial reporting only works when dashboards reconcile to the general ledger and make sense to finance stakeholders. Start with a controlled finance model that handles period status, fiscal calendars, legal entities, currencies, dimensions, chart-of-accounts mappings, and refresh cutoffs. For Dynamics 365 Finance reporting, that usually means modeling main accounts, financial dimensions, and ledger periods before building any visuals.
High-value finance use cases include:
- Budget versus actuals, with variance explanations
- Profit and loss by entity, business unit, customer, product, or channel
- Cash-flow visibility and working-capital analysis
- Accounts receivable aging and collections trends
- Accounts payable exposure and payment planning
- Revenue, cost, and gross-margin analysis
- Close status, exceptions, and reconciliation monitoring
- Project profitability and cost-to-complete
A practical control: give every official finance dashboard a defined reconciliation process. Before certifying the model for executive use, validate the trial balance, revenue, COGS, AR, and AP against approved ERP control totals.
Combine operational data for end-to-end visibility
Advanced ERP analytics answers questions no single application can. A supply chain leader may need to compare demand, inventory, supplier lead times, open purchase orders, capacity, and fulfillment performance. A finance leader may need to connect sales, margin, discounts, returns, and receivables.
Typical cross-functional Power BI ERP dashboards include:
| Business area | Decision question | Example KPIs |
|---|---|---|
| Finance | Are we on track against plan? | Revenue, EBITDA, budget variance, DSO, cash conversion cycle |
| Sales | Which accounts and products are growing profitably? | Pipeline-to-order conversion, net revenue, gross margin, discount rate |
| Supply chain | Where will service or inventory risk appear next? | Fill rate, stock-out risk, inventory aging, supplier OTIF, lead-time variance |
| Procurement | Which suppliers create cost or delivery risk? | Purchase-price variance, on-time delivery, open commitments, supplier concentration |
| Operations | Which processes slow fulfillment? | Order cycle time, backlog, on-time delivery, exception rate |
| Executive team | What needs attention now? | KPI trends, forecast variance, alerts, top exceptions by business impact |
For dashboard design techniques, see creating dynamic ERP dashboards with Microsoft Fabric. To move faster, Folio3’s pre-built reporting dashboards give you a starting point you can tailor to your processes, KPI definitions, and priorities.
Match data freshness to the business decision
Real-time is not automatically better. It adds engineering complexity, capacity consumption, testing, and governance overhead. Choose refresh frequency based on what freshness is worth to the decision.
| Reporting need | Usually appropriate freshness | Why |
|---|---|---|
| Month-end financial statements | Daily or controlled close-period refresh | Accuracy, reconciliation, and repeatability matter more than minutes |
| Executive performance dashboard | Daily or several intraday refreshes | Leaders need current trends without streaming complexity |
| Inventory availability and fulfillment exceptions | Near-real-time (minutes) or frequent intraday | Delays can affect customer service and operational decisions |
| Production, logistics, or IoT monitoring | Real-time, event-driven (seconds) | Immediate detection and response can create material operational value |
| Strategic planning and historical analysis | Daily or weekly | Long-term trends matter more than instant updates |
For Dynamics 365, low-latency sync for Link to Fabric became generally available in June 2026 and speeds replication from customer engagement and finance and operations apps. Microsoft reports sync times under 15 minutes in most observed cases, which fits the near-real-time row above, not the seconds-level row. Use it where a faster refresh changes a decision, not simply because it is available.
Select the right performance pattern
Every design balances speed, freshness, model complexity, cost, and security. Document why each major subject area uses its chosen pattern.
| Pattern | Best for | Watch-outs |
|---|---|---|
| Import | Highly optimized interactive reporting where scheduled refresh is enough | Needs refresh planning; creates duplicate datasets if ungoverned |
| Direct Lake | Large Fabric-managed models that need fast, interactive analytics from OneLake | Needs deliberate model design and capacity planning; test how queries behave when they fall back to DirectQuery |
| DirectQuery | Queries against a live or external source | Performance and concurrency limits if overused |
| Lakehouse | Flexible engineering, semi-structured data, data science, open formats | Needs data-engineering discipline and clear curation patterns |
| Warehouse | SQL-first analytics and business reporting models | Still needs strong dimensional modeling and governance |
Start with the business decision, required latency, data volume, concurrency, team skills, source constraints, and total operating cost. Then pick the pattern.
Advanced modeling patterns for ERP data
Many ERP reporting problems that surface after go-live trace back to a handful of modeling decisions. Settle them in the curated layer and semantic model, not in individual reports.
| Pattern | Problem it solves | Implementation guidance |
|---|---|---|
| Currency translation | Totals that differ across reports because each converts currency differently | Store transaction, accounting, and reporting currency amounts. Keep an exchange-rate table by rate type: average rates for P&L, closing rates for the balance sheet, historical rates for equity. Translate in the curated layer, not in visuals. |
| Intercompany eliminations | Consolidated revenue and payables that double-count internal trades | Tag intercompany accounts and trading partners in the standardized layer. Post eliminations to a separate elimination entity so both entity and consolidated views reconcile. Match intercompany balances before eliminating. |
| Periodic snapshots | AR aging, inventory on hand, and open POs that cannot be reproduced for a past date | Capture daily or month-end snapshot facts. Transaction tables alone cannot reliably rebuild last quarter’s aging buckets. |
| Slowly changing dimensions | History that shifts after a reorg, territory change, or cost-center remap | Decide per attribute whether reports show history “as it was” or “as it is now.” Use Type 2 history where finance or sales compensation depends on it, and document the choice. |
| Incremental refresh | Full reloads of large ledger and inventory tables that strain capacity and delay reports | Load by modified date and partition large facts by period. Keep open and reopened periods inside the refresh window so late postings are not missed. |
| Version control and deployment | Untested measure changes reaching executive reports | Use Fabric Git integration and deployment pipelines to move semantic models and pipelines through dev, test, and production. Review measure changes like code. |
These patterns matter most in multi-entity environments. A single-company Business Central tenant may need only snapshots and incremental refresh at first, while a multi-legal-entity Dynamics 365 Finance deployment usually needs all six.
Govern the metrics before scaling self-service BI
A Fabric ERP reporting program needs governance from day one. Without it, teams move spreadsheet inconsistency onto a more sophisticated platform.
Essential governance controls:
- KPI ownership: assign a business owner for each critical metric, such as revenue, margin, inventory value, order backlog, and on-time delivery.
- Metric definitions: keep a KPI glossary with formulas, source fields, inclusions, exclusions, period logic, and owner approval.
- Certified semantic models: publish approved, reusable models instead of letting each department recreate core measures.
- Role-based access: use workspace and data permissions so users see only the companies, business units, or financial data they are authorized to access.
- Row-level security: filter by legal entity, region, department, customer territory, or other access boundaries.
- Data lineage: make every dashboard number traceable to its model, curated table, transformation, and ERP source.
- Change control: test finance and executive-reporting changes before release, especially calculations, mappings, currency rules, and fiscal periods.
- Data-quality monitoring: watch for duplicates, missing keys, late-arriving data, invalid mappings, and reconciliation failures.
The test of maturity is simple. When a controller asks “Where did this number come from?”, the team can give a defensible answer quickly.
A sample 90-day pilot roadmap for Microsoft Fabric ERP reporting
A phased pilot reduces risk and shows stakeholders visible progress before an enterprise rollout. The timeline below assumes one data domain and reasonably clean source data; your scope, sources, and customization level will change it.
Days 1–30: Assess and prioritize
- Inventory current ERP reports, spreadsheets, dashboards, data sources, and refresh schedules.
- Interview finance, operations, IT, and executive stakeholders.
- Identify reporting pain points, duplicated KPIs, slow processes, and high-value decisions.
- Choose one initial data domain, such as finance, sales, inventory, or order fulfillment.
- Set success criteria: less manual effort, faster close, shorter refresh times, fewer conflicting reports, or better service-level visibility.
- Review security, compliance, source-system access, and data-retention requirements.
Days 31–60: Build the reporting foundation
- Configure the Fabric workspace and access model.
- Implement source ingestion and baseline data-quality checks.
- Create raw, standardized, and curated ERP data layers.
- Model core dimensions: date, legal entity, customer, product, supplier, cost center, and currency.
- Build a certified semantic model with a KPI glossary.
- Develop a focused dashboard pilot and run business validation.
Days 61–90: Productionize and expand
- Reconcile financial and operational control totals.
- Add row-level security, monitoring, lineage, and deployment standards.
- Tune capacity, refresh schedules, and report performance.
- Train report creators, analysts, data stewards, and business users.
- Publish adoption guidance and a request and change process.
- Prioritize the next data domain and the cross-functional dashboard backlog.
If you need hands-on delivery capacity, you can hire a Microsoft Fabric consultant through Folio3 for architecture, ingestion, engineering, semantic models, Power BI, governance, migration, and optimization.
Common mistakes to avoid
Treating Fabric as a dashboard-only tool
A dashboard project without data modeling, governance, quality checks, and shared measures can look successful for a few months, then stall. Treat Fabric as a data and analytics operating model with reporting as one output.
Copying every ERP table without a business purpose
Start with priority business outcomes. Then identify the source data, transformations, model, controls, and reporting each outcome needs, and replicate only those tables.
Bypassing financial reconciliation
Do not label a report “official” until finance has validated its logic, time period, currency treatment, legal-entity scope, and control totals.
Giving every department a different KPI formula
Business users can explore data freely, but enterprise metrics must be shared and governed. Keep core calculations in certified semantic models, with a named owner for each definition.
Designing for one company or region
Plan early for multi-entity security, local calendars, currencies, account mappings, time zones, master-data variations, and organizational changes. Retrofitting these controls later is expensive.
Ignoring skills and adoption
A technically sound platform still fails if users don’t understand the semantic model, how to read KPIs, or when to trust the data. Train both report creators and report consumers. Folio3’s Microsoft Fabric training supports role-based enablement for business, BI, and technical teams.
Dynamics 365 and Business Central reporting paths
The right architecture reflects which Dynamics application you run, the processes that matter most, and your current reporting maturity.
Microsoft Fabric Dynamics 365 reporting
Dynamics 365 Finance and Supply Chain Management organizations commonly prioritize finance, procurement, inventory, order fulfillment, project operations, manufacturing, and multi-legal-entity reporting. Link to Fabric is usually the first ingestion option to evaluate, because it brings finance and operations tables into OneLake without custom pipelines.
Start Dynamics 365 reporting with Microsoft Fabric in the domain that has both measurable pain and a trusted business owner. That is often financial performance, inventory, or order-to-cash. For an implementation walkthrough, see our guide to implementing Microsoft Fabric for Dynamics 365 Finance and Operations.
To speed up adoption, Folio3’s pre-built reporting dashboards for Dynamics 365 provide a structured starting point for finance, operations, and executive reporting.
Business Central reporting with Microsoft Fabric
Business Central teams often begin with finance, sales, purchasing, inventory, customer, vendor, and fulfillment visibility. The next step is combining Business Central data with CRM, eCommerce, logistics, and budgeting systems in one governed model.
Because Business Central data is not natively stored in Dataverse, plan ingestion separately. Use Business Central APIs with an orchestration and transformation layer, such as Azure Data Factory, or use a supported partner-managed mirroring solution. Validate API limits, refresh latency, and storage implications early.
Folio3’s pre-built reporting dashboards for Business Central help teams deliver faster while leaving room for organization-specific KPIs, security, and integrations.
Extend reporting with AI-ready data
Once ERP data is connected, cleaned, governed, and modeled, you can move from descriptive reporting to proactive analysis. Good next steps include forecast variance analysis, anomaly detection, inventory risk signals, cash-flow scenarios, supplier-risk monitoring, and natural-language questions over trusted metrics.
The prerequisites are reliable data, approved business definitions, secure access, and traceability. With those in place, Folio3’s Fabric Data Agents service helps teams query governed Fabric data in natural language and act on the answers.
Microsoft Fabric ERP reporting FAQs
What is Microsoft Fabric ERP reporting?
Microsoft Fabric ERP reporting uses Fabric’s data integration, engineering, warehousing, governance, and Power BI capabilities to analyze ERP data at scale. ERP data lands in OneLake, is modeled and governed centrally, and is combined with other business data for finance, operations, and executive reporting.
Can Microsoft Fabric replace an ERP system?
No. The ERP remains the transactional system of record for operations, accounting, purchasing, inventory, and order processing. Fabric is the analytics layer that integrates, models, governs, and analyzes ERP and related data.
Can Microsoft Fabric improve Dynamics 365 reporting?
Yes. Fabric brings Dynamics 365 data into a governed analytics foundation, often through Link to Fabric, combines it with other sources, and serves it through reusable Power BI semantic models. The right design depends on your freshness, security, data volume, and business requirements.
What is the best Microsoft Fabric architecture for ERP reporting?
There is no single universal design. A common pattern uses supported ERP ingestion or replication, OneLake as the shared foundation, Lakehouse and/or Warehouse layers for curated data, a certified Power BI semantic model for KPI consistency and security, and Power BI for consumption. Source systems, latency needs, data scale, governance obligations, and team skills shape the final design.
Does ERP data need to be real-time in Microsoft Fabric?
Not always. Use real-time or low-latency patterns only where delayed information changes an important decision, such as fulfillment exceptions or production events. Daily or controlled scheduled refreshes are often better for month-end, finance, and strategic reporting.
How do organizations ensure financial dashboards are accurate?
They compare Fabric outputs to ERP control totals, document accounting logic and period cutoffs, govern chart-of-accounts and dimension mappings, validate currency treatment, and require finance approval before certifying official reporting models.
How long does a Microsoft Fabric ERP reporting implementation take?
It depends on the number of sources, data quality, ERP customization, reporting scope, integration pattern, security requirements, and governance maturity. A focused pilot usually starts with one high-value domain and expands in phases after validation. A readiness assessment helps set a defensible roadmap.
Turn ERP data into trusted decisions
The most effective Microsoft Fabric ERP reporting initiatives start with a few high-value business decisions, a governed data foundation, finance and operational validation, and a roadmap that can scale.
Folio3 helps organizations assess reporting maturity, design Fabric architecture, migrate data and reporting workloads, build trusted semantic models, deliver Power BI dashboards, establish governance, and train internal teams. See how we automated Power BI reporting pipelines with Microsoft Fabric for a food verification company.
Whether you are improving Dynamics 365 reporting, modernizing Business Central analytics, or unifying ERP data with other systems, the first step is a clear view of your current state and your highest-value reporting opportunities.
Schedule a Microsoft Fabric analytics consultation to define the architecture, roadmap, and reporting priorities that fit your ERP environment.